Guides and Tutorials
Embedded Analytics & Reporting Builder Support Portal Documentation
Introduction
Welcome to the Support Portal for the Embedded Analytics & Reporting Builder. Our platform offers white-label dashboards and report builders that can be embedded in your product, allowing your customers to generate their own charts and exports without custom development work. This documentation will cover all aspects of using and integrating our analytics solution into your software product.
Tell Us What You Think
We're trying to build something great, but we need your unique perspective to make it even better. Don't hold back and let us know what's on your mind.
Feedback Form
Need to share your thoughts directly? Use the feedback form to leave a quick text feedback.

Ask a Question (Q&A Section)
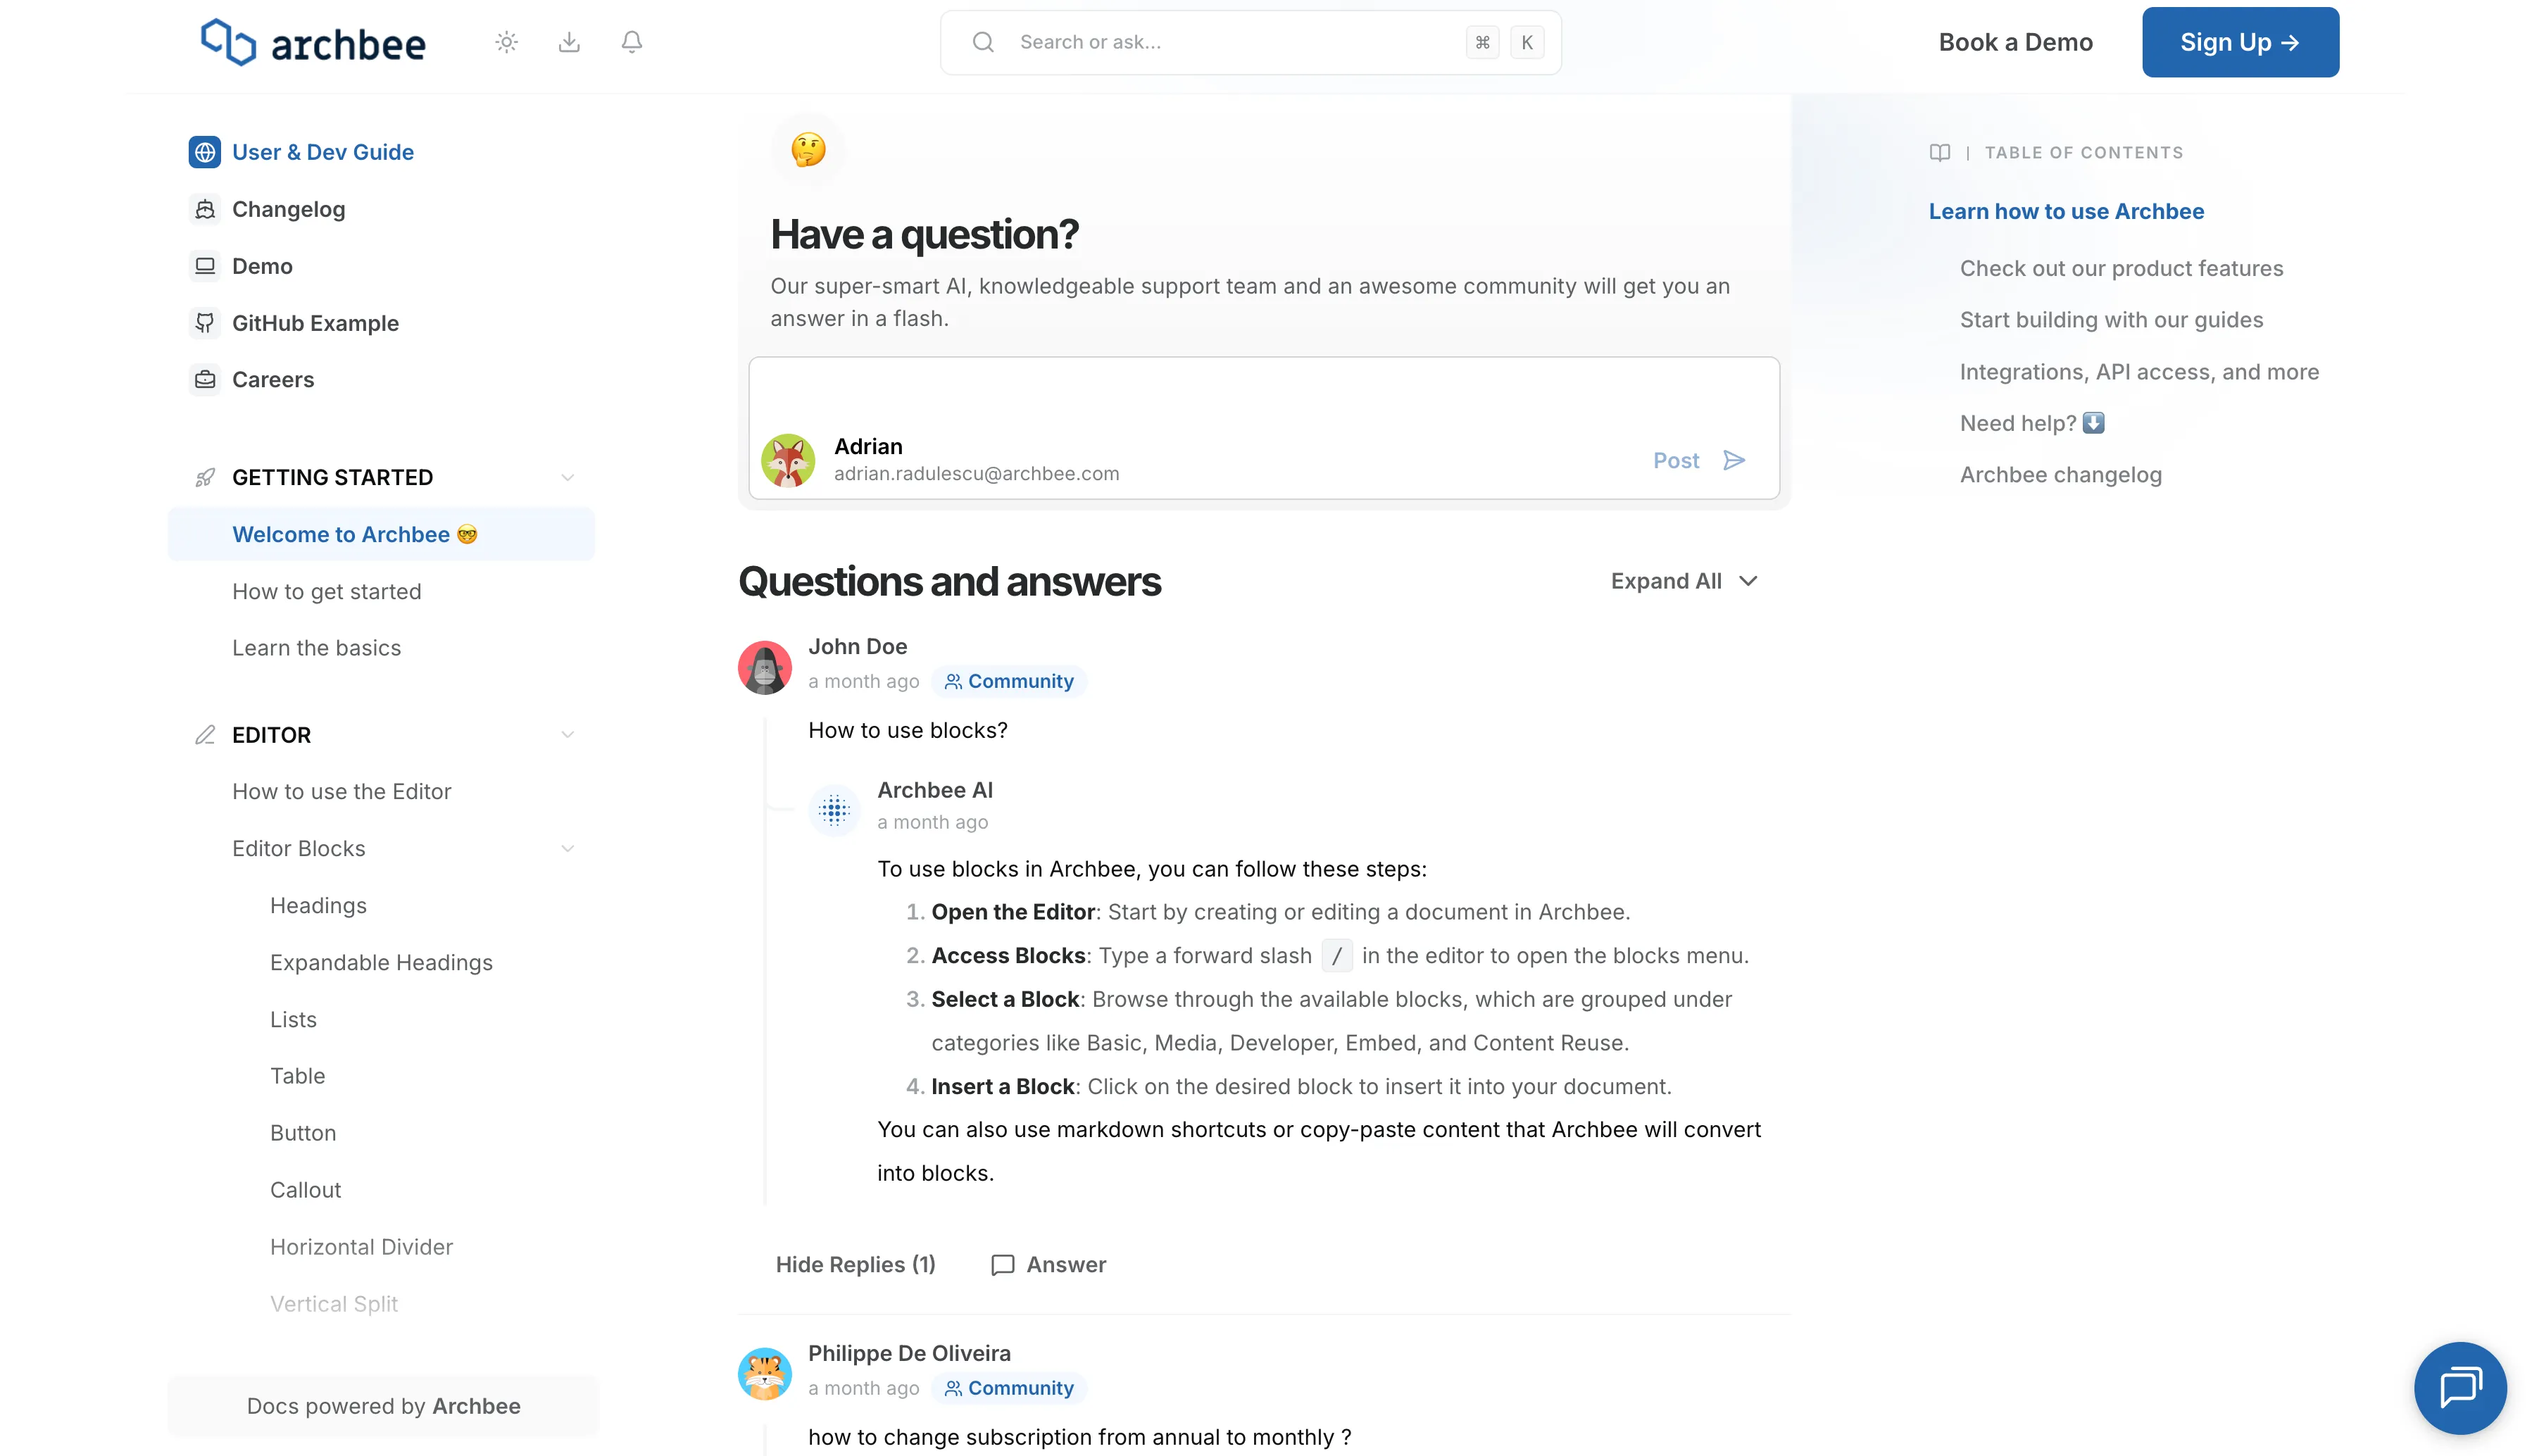
Have a specific problem or need a solution? Post it here! Below is a public section where our community, our team, or our AI can respond and offer help.
Support Chat
Need personalized support right now? Use the blue chat bubble in the bottom-right corner. This connects you immediately with our support team.

Core Value Proposition
Our solution provides the ability for software companies to embed a complete analytics platform directly into their product, freeing up development resources and offering end-users self-service reporting capabilities. Customers can create customized dashboards, visualize data, and export reports directly within your application's user interface.
Why Choose Embedded Analytics & Reporting Builder?
- Faster implementation compared to building analytics in-house
- Automated updates and new chart types
- Reduces support burden, allowing users to answer their own questions with reports
- Intuitive user experience adhering to modern SaaS standards
Key Features
1. Visual Report Builder (No-Code Interface)
- Drag-and-drop interface for creating charts, tables, and visualizations.
- Supports a variety of chart types including bar, line, pie, scatter, heatmaps, funnels, and cohort analysis.
- Offers easy-to-use filters, grouping, and aggregation controls for non-technical users.
- Provides real-time preview while building reports.
2. Data Source Connectors
- Connects to your product's databases like PostgreSQL, MySQL, MongoDB, etc.
- API-based data ingestion for custom data sources.
- Includes pre-built connectors for popular services like Stripe and Salesforce.
- Features a data transformation layer for cleaning and normalizing data before visualization.
3. White-Label Customization
- Fully branded to match your product including colors, fonts, and logos.
- Supports custom domains for hosted dashboards.
- Provides CSS and theme customization options.
- Embedding options via iframe, JavaScript SDK, or React components.
4. Dashboard Templates
- Includes pre-built templates for common use cases such as sales analytics, user engagement, and financial reporting.
- Offers a template marketplace for customers to share and discover dashboards.
- Allows cloning and customizing of templates.
5. Sharing & Collaboration
- Schedule automated report delivery via email (daily/weekly/monthly).
- Allows export to PDF, Excel, CSV, or image formats.
- Creates shareable links with permission controls (view-only, edit, admin).
- Facilitates comment threads on specific charts.
6. Security & Permissions
- Features row-level security to ensure tenants only see their own data.
- Role-based access control to define who can create versus view reports.
- Offers SSO integration with SAML and OAuth.
- Maintains audit logs for data access.
7. Performance & Scalability
- Implements query caching to minimize database load.
- Utilizes pre-aggregated data tables for efficient querying of large datasets.
- Delivers embedded components via CDN for optimal performance.
- Provides real-time or scheduled data refresh options.
8. Developer Experience
- REST API for programmatic dashboard/report creation.
- Webhooks for events like new report creation and data export requests.
- SQL editor for power users requiring direct query access.
- Embedded SDK with callbacks and event handlers.
9. Analytics on Analytics
- Tracks report usage to identify commonly utilized reports.
- Identifies power users versus inactive users.
- Offers usage metrics for proactive capacity planning.
Technical Architecture
Backend
- Query engine translates visual configurations into optimized SQL.
- Multi-tenant data isolation layer.
- Caching layer (Redis) optimizes frequently accessed reports.
- Background job queue manages scheduled reports and exports.
Frontend
- React-based chart library leveraging D3.js, Chart.js, or Recharts.
- Ensures responsive design for mobile and tablet devices.
- Compliant with accessibility standards (WCAG 2.1).
Deployment
- Cloud-hosted options on AWS or GCP with multi-region support.
- On-premise installation option available for enterprise customers.
- Kubernetes-based implementation for auto-scaling.
Pricing Model
- Tiered pricing based on the number of end-users who can access reports.
- Additional charges based on data volume processed.
- Enterprise tier for on-premise deployment and custom connectors.
Competitive Differentiation
Our Embedded Analytics & Reporting Builder offers enterprise-grade analytics as a feature without the development cost and time associated with building in-house solutions. We constantly update and introduce new chart types, minimizing your engineering effort while maintaining a seamless, modern user experience.
For further assistance, please refer to the specific guides and tutorials included in this portal. Happy analyzing!
Embedded Analytics & Reporting Builder Support Portal Documentation
Introduction
Welcome to the Support Portal for the Embedded Analytics & Reporting Builder. Our platform offers white-label dashboards and report builders that can be embedded in your product, allowing your customers to generate their own charts and exports without custom development work. This documentation will cover all aspects of using and integrating our analytics solution into your software product.
Tell Us What You Think
We're trying to build something great, but we need your unique perspective to make it even better. Don't hold back and let us know what's on your mind.
Feedback Form
Need to share your thoughts directly? Use the feedback form to leave a quick text feedback.
Ask a Question (Q&A Section)
Have a specific problem or need a solution? Post it here! Below is a public section where our community, our team, or our AI can respond and offer help.
Support Chat
Need personalized support right now? Use the blue chat bubble in the bottom-right corner. This connects you immediately with our support team.
Core Value Proposition
Our solution provides the ability for software companies to embed a complete analytics platform directly into their product, freeing up development resources and offering end-users self-service reporting capabilities. Customers can create customized dashboards, visualize data, and export reports directly within your application's user interface.
Why Choose Embedded Analytics & Reporting Builder?
- Faster implementation compared to building analytics in-house
- Automated updates and new chart types
- Reduces support burden, allowing users to answer their own questions with reports
- Intuitive user experience adhering to modern SaaS standards
Key Features
1. Visual Report Builder (No-Code Interface)
- Drag-and-drop interface for creating charts, tables, and visualizations.
- Supports a variety of chart types including bar, line, pie, scatter, heatmaps, funnels, and cohort analysis.
- Offers easy-to-use filters, grouping, and aggregation controls for non-technical users.
- Provides real-time preview while building reports.
2. Data Source Connectors
- Connects to your product's databases like PostgreSQL, MySQL, MongoDB, etc.
- API-based data ingestion for custom data sources.
- Includes pre-built connectors for popular services like Stripe and Salesforce.
- Features a data transformation layer for cleaning and normalizing data before visualization.
3. White-Label Customization
- Fully branded to match your product including colors, fonts, and logos.
- Supports custom domains for hosted dashboards.
- Provides CSS and theme customization options.
- Embedding options via iframe, JavaScript SDK, or React components.
4. Dashboard Templates
- Includes pre-built templates for common use cases such as sales analytics, user engagement, and financial reporting.
- Offers a template marketplace for customers to share and discover dashboards.
- Allows cloning and customizing of templates.
5. Sharing & Collaboration
- Schedule automated report delivery via email (daily/weekly/monthly).
- Allows export to PDF, Excel, CSV, or image formats.
- Creates shareable links with permission controls (view-only, edit, admin).
- Facilitates comment threads on specific charts.
6. Security & Permissions
- Features row-level security to ensure tenants only see their own data.
- Role-based access control to define who can create versus view reports.
- Offers SSO integration with SAML and OAuth.
- Maintains audit logs for data access.
7. Performance & Scalability
- Implements query caching to minimize database load.
- Utilizes pre-aggregated data tables for efficient querying of large datasets.
- Delivers embedded components via CDN for optimal performance.
- Provides real-time or scheduled data refresh options.
8. Developer Experience
- REST API for programmatic dashboard/report creation.
- Webhooks for events like new report creation and data export requests.
- SQL editor for power users requiring direct query access.
- Embedded SDK with callbacks and event handlers.
9. Analytics on Analytics
- Tracks report usage to identify commonly utilized reports.
- Identifies power users versus inactive users.
- Offers usage metrics for proactive capacity planning.
Technical Architecture
Backend
- Query engine translates visual configurations into optimized SQL.
- Multi-tenant data isolation layer.
- Caching layer (Redis) optimizes frequently accessed reports.
- Background job queue manages scheduled reports and exports.
Frontend
- React-based chart library leveraging D3.js, Chart.js, or Recharts.
- Ensures responsive design for mobile and tablet devices.
- Compliant with accessibility standards (WCAG 2.1).
Deployment
- Cloud-hosted options on AWS or GCP with multi-region support.
- On-premise installation option available for enterprise customers.
- Kubernetes-based implementation for auto-scaling.
Pricing Model
- Tiered pricing based on the number of end-users who can access reports.
- Additional charges based on data volume processed.
- Enterprise tier for on-premise deployment and custom connectors.
Competitive Differentiation
Our Embedded Analytics & Reporting Builder offers enterprise-grade analytics as a feature without the development cost and time associated with building in-house solutions. We constantly update and introduce new chart types, minimizing your engineering effort while maintaining a seamless, modern user experience.
For further assistance, please refer to the specific guides and tutorials included in this portal. Happy analyzing!
Embedded Analytics & Reporting Builder Support Portal Documentation
Introduction
Welcome to the Support Portal for the Embedded Analytics & Reporting Builder. Our platform offers white-label dashboards and report builders that can be embedded in your product, allowing your customers to generate their own charts and exports without custom development work. This documentation will cover all aspects of using and integrating our analytics solution into your software product.
Tell Us What You Think
We're trying to build something great, but we need your unique perspective to make it even better. Don't hold back and let us know what's on your mind.
Feedback Form
Need to share your thoughts directly? Use the feedback form to leave a quick text feedback.
Ask a Question (Q&A Section)
Have a specific problem or need a solution? Post it here! Below is a public section where our community, our team, or our AI can respond and offer help.
Support Chat
Need personalized support right now? Use the blue chat bubble in the bottom-right corner. This connects you immediately with our support team.
Core Value Proposition
Our solution provides the ability for software companies to embed a complete analytics platform directly into their product, freeing up development resources and offering end-users self-service reporting capabilities. Customers can create customized dashboards, visualize data, and export reports directly within your application's user interface.
Why Choose Embedded Analytics & Reporting Builder?
- Faster implementation compared to building analytics in-house
- Automated updates and new chart types
- Reduces support burden, allowing users to answer their own questions with reports
- Intuitive user experience adhering to modern SaaS standards
Key Features
1. Visual Report Builder (No-Code Interface)
- Drag-and-drop interface for creating charts, tables, and visualizations.
- Supports a variety of chart types including bar, line, pie, scatter, heatmaps, funnels, and cohort analysis.
- Offers easy-to-use filters, grouping, and aggregation controls for non-technical users.
- Provides real-time preview while building reports.
2. Data Source Connectors
- Connects to your product's databases like PostgreSQL, MySQL, MongoDB, etc.
- API-based data ingestion for custom data sources.
- Includes pre-built connectors for popular services like Stripe and Salesforce.
- Features a data transformation layer for cleaning and normalizing data before visualization.
3. White-Label Customization
- Fully branded to match your product including colors, fonts, and logos.
- Supports custom domains for hosted dashboards.
- Provides CSS and theme customization options.
- Embedding options via iframe, JavaScript SDK, or React components.
4. Dashboard Templates
- Includes pre-built templates for common use cases such as sales analytics, user engagement, and financial reporting.
- Offers a template marketplace for customers to share and discover dashboards.
- Allows cloning and customizing of templates.
5. Sharing & Collaboration
- Schedule automated report delivery via email (daily/weekly/monthly).
- Allows export to PDF, Excel, CSV, or image formats.
- Creates shareable links with permission controls (view-only, edit, admin).
- Facilitates comment threads on specific charts.
6. Security & Permissions
- Features row-level security to ensure tenants only see their own data.
- Role-based access control to define who can create versus view reports.
- Offers SSO integration with SAML and OAuth.
- Maintains audit logs for data access.
7. Performance & Scalability
- Implements query caching to minimize database load.
- Utilizes pre-aggregated data tables for efficient querying of large datasets.
- Delivers embedded components via CDN for optimal performance.
- Provides real-time or scheduled data refresh options.
8. Developer Experience
- REST API for programmatic dashboard/report creation.
- Webhooks for events like new report creation and data export requests.
- SQL editor for power users requiring direct query access.
- Embedded SDK with callbacks and event handlers.
9. Analytics on Analytics
- Tracks report usage to identify commonly utilized reports.
- Identifies power users versus inactive users.
- Offers usage metrics for proactive capacity planning.
Technical Architecture
Backend
- Query engine translates visual configurations into optimized SQL.
- Multi-tenant data isolation layer.
- Caching layer (Redis) optimizes frequently accessed reports.
- Background job queue manages scheduled reports and exports.
Frontend
- React-based chart library leveraging D3.js, Chart.js, or Recharts.
- Ensures responsive design for mobile and tablet devices.
- Compliant with accessibility standards (WCAG 2.1).
Deployment
- Cloud-hosted options on AWS or GCP with multi-region support.
- On-premise installation option available for enterprise customers.
- Kubernetes-based implementation for auto-scaling.
Pricing Model
- Tiered pricing based on the number of end-users who can access reports.
- Additional charges based on data volume processed.
- Enterprise tier for on-premise deployment and custom connectors.
Competitive Differentiation
Our Embedded Analytics & Reporting Builder offers enterprise-grade analytics as a feature without the development cost and time associated with building in-house solutions. We constantly update and introduce new chart types, minimizing your engineering effort while maintaining a seamless, modern user experience.
For further assistance, please refer to the specific guides and tutorials included in this portal. Happy analyzing!
Embedded Analytics & Reporting Builder Support Portal Documentation
Introduction
Welcome to the Support Portal for the Embedded Analytics & Reporting Builder. Our platform offers white-label dashboards and report builders that can be embedded in your product, allowing your customers to generate their own charts and exports without custom development work. This documentation will cover all aspects of using and integrating our analytics solution into your software product.
Tell Us What You Think
We're trying to build something great, but we need your unique perspective to make it even better. Don't hold back and let us know what's on your mind.
Feedback Form
Need to share your thoughts directly? Use the feedback form to leave a quick text feedback.
Ask a Question (Q&A Section)
Have a specific problem or need a solution? Post it here! Below is a public section where our community, our team, or our AI can respond and offer help.
Support Chat
Need personalized support right now? Use the blue chat bubble in the bottom-right corner. This connects you immediately with our support team.
Core Value Proposition
Our solution provides the ability for software companies to embed a complete analytics platform directly into their product, freeing up development resources and offering end-users self-service reporting capabilities. Customers can create customized dashboards, visualize data, and export reports directly within your application's user interface.
Why Choose Embedded Analytics & Reporting Builder?
- Faster implementation compared to building analytics in-house
- Automated updates and new chart types
- Reduces support burden, allowing users to answer their own questions with reports
- Intuitive user experience adhering to modern SaaS standards
Key Features
1. Visual Report Builder (No-Code Interface)
- Drag-and-drop interface for creating charts, tables, and visualizations.
- Supports a variety of chart types including bar, line, pie, scatter, heatmaps, funnels, and cohort analysis.
- Offers easy-to-use filters, grouping, and aggregation controls for non-technical users.
- Provides real-time preview while building reports.
2. Data Source Connectors
- Connects to your product's databases like PostgreSQL, MySQL, MongoDB, etc.
- API-based data ingestion for custom data sources.
- Includes pre-built connectors for popular services like Stripe and Salesforce.
- Features a data transformation layer for cleaning and normalizing data before visualization.
3. White-Label Customization
- Fully branded to match your product including colors, fonts, and logos.
- Supports custom domains for hosted dashboards.
- Provides CSS and theme customization options.
- Embedding options via iframe, JavaScript SDK, or React components.
4. Dashboard Templates
- Includes pre-built templates for common use cases such as sales analytics, user engagement, and financial reporting.
- Offers a template marketplace for customers to share and discover dashboards.
- Allows cloning and customizing of templates.
5. Sharing & Collaboration
- Schedule automated report delivery via email (daily/weekly/monthly).
- Allows export to PDF, Excel, CSV, or image formats.
- Creates shareable links with permission controls (view-only, edit, admin).
- Facilitates comment threads on specific charts.
6. Security & Permissions
- Features row-level security to ensure tenants only see their own data.
- Role-based access control to define who can create versus view reports.
- Offers SSO integration with SAML and OAuth.
- Maintains audit logs for data access.
7. Performance & Scalability
- Implements query caching to minimize database load.
- Utilizes pre-aggregated data tables for efficient querying of large datasets.
- Delivers embedded components via CDN for optimal performance.
- Provides real-time or scheduled data refresh options.
8. Developer Experience
- REST API for programmatic dashboard/report creation.
- Webhooks for events like new report creation and data export requests.
- SQL editor for power users requiring direct query access.
- Embedded SDK with callbacks and event handlers.
9. Analytics on Analytics
- Tracks report usage to identify commonly utilized reports.
- Identifies power users versus inactive users.
- Offers usage metrics for proactive capacity planning.
Technical Architecture
Backend
- Query engine translates visual configurations into optimized SQL.
- Multi-tenant data isolation layer.
- Caching layer (Redis) optimizes frequently accessed reports.
- Background job queue manages scheduled reports and exports.
Frontend
- React-based chart library leveraging D3.js, Chart.js, or Recharts.
- Ensures responsive design for mobile and tablet devices.
- Compliant with accessibility standards (WCAG 2.1).
Deployment
- Cloud-hosted options on AWS or GCP with multi-region support.
- On-premise installation option available for enterprise customers.
- Kubernetes-based implementation for auto-scaling.
Pricing Model
- Tiered pricing based on the number of end-users who can access reports.
- Additional charges based on data volume processed.
- Enterprise tier for on-premise deployment and custom connectors.
Competitive Differentiation
Our Embedded Analytics & Reporting Builder offers enterprise-grade analytics as a feature without the development cost and time associated with building in-house solutions. We constantly update and introduce new chart types, minimizing your engineering effort while maintaining a seamless, modern user experience.
For further assistance, please refer to the specific guides and tutorials included in this portal. Happy analyzing!
Embedded Analytics & Reporting Builder Support Portal Documentation
Introduction
Welcome to the Support Portal for the Embedded Analytics & Reporting Builder. Our platform offers white-label dashboards and report builders that can be embedded in your product, allowing your customers to generate their own charts and exports without custom development work. This documentation will cover all aspects of using and integrating our analytics solution into your software product.
Tell Us What You Think
We're trying to build something great, but we need your unique perspective to make it even better. Don't hold back and let us know what's on your mind.
Feedback Form
Need to share your thoughts directly? Use the feedback form to leave a quick text feedback.
Ask a Question (Q&A Section)
Have a specific problem or need a solution? Post it here! Below is a public section where our community, our team, or our AI can respond and offer help.
Support Chat
Need personalized support right now? Use the blue chat bubble in the bottom-right corner. This connects you immediately with our support team.
Core Value Proposition
Our solution provides the ability for software companies to embed a complete analytics platform directly into their product, freeing up development resources and offering end-users self-service reporting capabilities. Customers can create customized dashboards, visualize data, and export reports directly within your application's user interface.
Why Choose Embedded Analytics & Reporting Builder?
- Faster implementation compared to building analytics in-house
- Automated updates and new chart types
- Reduces support burden, allowing users to answer their own questions with reports
- Intuitive user experience adhering to modern SaaS standards
Key Features
1. Visual Report Builder (No-Code Interface)
- Drag-and-drop interface for creating charts, tables, and visualizations.
- Supports a variety of chart types including bar, line, pie, scatter, heatmaps, funnels, and cohort analysis.
- Offers easy-to-use filters, grouping, and aggregation controls for non-technical users.
- Provides real-time preview while building reports.
2. Data Source Connectors
- Connects to your product's databases like PostgreSQL, MySQL, MongoDB, etc.
- API-based data ingestion for custom data sources.
- Includes pre-built connectors for popular services like Stripe and Salesforce.
- Features a data transformation layer for cleaning and normalizing data before visualization.
3. White-Label Customization
- Fully branded to match your product including colors, fonts, and logos.
- Supports custom domains for hosted dashboards.
- Provides CSS and theme customization options.
- Embedding options via iframe, JavaScript SDK, or React components.
4. Dashboard Templates
- Includes pre-built templates for common use cases such as sales analytics, user engagement, and financial reporting.
- Offers a template marketplace for customers to share and discover dashboards.
- Allows cloning and customizing of templates.
5. Sharing & Collaboration
- Schedule automated report delivery via email (daily/weekly/monthly).
- Allows export to PDF, Excel, CSV, or image formats.
- Creates shareable links with permission controls (view-only, edit, admin).
- Facilitates comment threads on specific charts.
6. Security & Permissions
- Features row-level security to ensure tenants only see their own data.
- Role-based access control to define who can create versus view reports.
- Offers SSO integration with SAML and OAuth.
- Maintains audit logs for data access.
7. Performance & Scalability
- Implements query caching to minimize database load.
- Utilizes pre-aggregated data tables for efficient querying of large datasets.
- Delivers embedded components via CDN for optimal performance.
- Provides real-time or scheduled data refresh options.
8. Developer Experience
- REST API for programmatic dashboard/report creation.
- Webhooks for events like new report creation and data export requests.
- SQL editor for power users requiring direct query access.
- Embedded SDK with callbacks and event handlers.
9. Analytics on Analytics
- Tracks report usage to identify commonly utilized reports.
- Identifies power users versus inactive users.
- Offers usage metrics for proactive capacity planning.
Technical Architecture
Backend
- Query engine translates visual configurations into optimized SQL.
- Multi-tenant data isolation layer.
- Caching layer (Redis) optimizes frequently accessed reports.
- Background job queue manages scheduled reports and exports.
Frontend
- React-based chart library leveraging D3.js, Chart.js, or Recharts.
- Ensures responsive design for mobile and tablet devices.
- Compliant with accessibility standards (WCAG 2.1).
Deployment
- Cloud-hosted options on AWS or GCP with multi-region support.
- On-premise installation option available for enterprise customers.
- Kubernetes-based implementation for auto-scaling.
Pricing Model
- Tiered pricing based on the number of end-users who can access reports.
- Additional charges based on data volume processed.
- Enterprise tier for on-premise deployment and custom connectors.
Competitive Differentiation
Our Embedded Analytics & Reporting Builder offers enterprise-grade analytics as a feature without the development cost and time associated with building in-house solutions. We constantly update and introduce new chart types, minimizing your engineering effort while maintaining a seamless, modern user experience.
For further assistance, please refer to the specific guides and tutorials included in this portal. Happy analyzing!
Embedded Analytics & Reporting Builder Support Portal Documentation
Introduction
Welcome to the Support Portal for the Embedded Analytics & Reporting Builder. Our platform offers white-label dashboards and report builders that can be embedded in your product, allowing your customers to generate their own charts and exports without custom development work. This documentation will cover all aspects of using and integrating our analytics solution into your software product.
Tell Us What You Think
We're trying to build something great, but we need your unique perspective to make it even better. Don't hold back and let us know what's on your mind.
Feedback Form
Need to share your thoughts directly? Use the feedback form to leave a quick text feedback.
Ask a Question (Q&A Section)
Have a specific problem or need a solution? Post it here! Below is a public section where our community, our team, or our AI can respond and offer help.
Support Chat
Need personalized support right now? Use the blue chat bubble in the bottom-right corner. This connects you immediately with our support team.
Core Value Proposition
Our solution provides the ability for software companies to embed a complete analytics platform directly into their product, freeing up development resources and offering end-users self-service reporting capabilities. Customers can create customized dashboards, visualize data, and export reports directly within your application's user interface.
Why Choose Embedded Analytics & Reporting Builder?
- Faster implementation compared to building analytics in-house
- Automated updates and new chart types
- Reduces support burden, allowing users to answer their own questions with reports
- Intuitive user experience adhering to modern SaaS standards
Key Features
1. Visual Report Builder (No-Code Interface)
- Drag-and-drop interface for creating charts, tables, and visualizations.
- Supports a variety of chart types including bar, line, pie, scatter, heatmaps, funnels, and cohort analysis.
- Offers easy-to-use filters, grouping, and aggregation controls for non-technical users.
- Provides real-time preview while building reports.
2. Data Source Connectors
- Connects to your product's databases like PostgreSQL, MySQL, MongoDB, etc.
- API-based data ingestion for custom data sources.
- Includes pre-built connectors for popular services like Stripe and Salesforce.
- Features a data transformation layer for cleaning and normalizing data before visualization.
3. White-Label Customization
- Fully branded to match your product including colors, fonts, and logos.
- Supports custom domains for hosted dashboards.
- Provides CSS and theme customization options.
- Embedding options via iframe, JavaScript SDK, or React components.
4. Dashboard Templates
- Includes pre-built templates for common use cases such as sales analytics, user engagement, and financial reporting.
- Offers a template marketplace for customers to share and discover dashboards.
- Allows cloning and customizing of templates.
5. Sharing & Collaboration
- Schedule automated report delivery via email (daily/weekly/monthly).
- Allows export to PDF, Excel, CSV, or image formats.
- Creates shareable links with permission controls (view-only, edit, admin).
- Facilitates comment threads on specific charts.
6. Security & Permissions
- Features row-level security to ensure tenants only see their own data.
- Role-based access control to define who can create versus view reports.
- Offers SSO integration with SAML and OAuth.
- Maintains audit logs for data access.
7. Performance & Scalability
- Implements query caching to minimize database load.
- Utilizes pre-aggregated data tables for efficient querying of large datasets.
- Delivers embedded components via CDN for optimal performance.
- Provides real-time or scheduled data refresh options.
8. Developer Experience
- REST API for programmatic dashboard/report creation.
- Webhooks for events like new report creation and data export requests.
- SQL editor for power users requiring direct query access.
- Embedded SDK with callbacks and event handlers.
9. Analytics on Analytics
- Tracks report usage to identify commonly utilized reports.
- Identifies power users versus inactive users.
- Offers usage metrics for proactive capacity planning.
Technical Architecture
Backend
- Query engine translates visual configurations into optimized SQL.
- Multi-tenant data isolation layer.
- Caching layer (Redis) optimizes frequently accessed reports.
- Background job queue manages scheduled reports and exports.
Frontend
- React-based chart library leveraging D3.js, Chart.js, or Recharts.
- Ensures responsive design for mobile and tablet devices.
- Compliant with accessibility standards (WCAG 2.1).
Deployment
- Cloud-hosted options on AWS or GCP with multi-region support.
- On-premise installation option available for enterprise customers.
- Kubernetes-based implementation for auto-scaling.
Pricing Model
- Tiered pricing based on the number of end-users who can access reports.
- Additional charges based on data volume processed.
- Enterprise tier for on-premise deployment and custom connectors.
Competitive Differentiation
Our Embedded Analytics & Reporting Builder offers enterprise-grade analytics as a feature without the development cost and time associated with building in-house solutions. We constantly update and introduce new chart types, minimizing your engineering effort while maintaining a seamless, modern user experience.
For further assistance, please refer to the specific guides and tutorials included in this portal. Happy analyzing!
Embedded Analytics & Reporting Builder Support Portal Documentation
Introduction
Welcome to the Support Portal for the Embedded Analytics & Reporting Builder. Our platform offers white-label dashboards and report builders that can be embedded in your product, allowing your customers to generate their own charts and exports without custom development work. This documentation will cover all aspects of using and integrating our analytics solution into your software product.
Tell Us What You Think
We're trying to build something great, but we need your unique perspective to make it even better. Don't hold back and let us know what's on your mind.
Feedback Form
Need to share your thoughts directly? Use the feedback form to leave a quick text feedback.
Ask a Question (Q&A Section)
Have a specific problem or need a solution? Post it here! Below is a public section where our community, our team, or our AI can respond and offer help.
Support Chat
Need personalized support right now? Use the blue chat bubble in the bottom-right corner. This connects you immediately with our support team.
Core Value Proposition
Our solution provides the ability for software companies to embed a complete analytics platform directly into their product, freeing up development resources and offering end-users self-service reporting capabilities. Customers can create customized dashboards, visualize data, and export reports directly within your application's user interface.
Why Choose Embedded Analytics & Reporting Builder?
- Faster implementation compared to building analytics in-house
- Automated updates and new chart types
- Reduces support burden, allowing users to answer their own questions with reports
- Intuitive user experience adhering to modern SaaS standards
Key Features
1. Visual Report Builder (No-Code Interface)
- Drag-and-drop interface for creating charts, tables, and visualizations.
- Supports a variety of chart types including bar, line, pie, scatter, heatmaps, funnels, and cohort analysis.
- Offers easy-to-use filters, grouping, and aggregation controls for non-technical users.
- Provides real-time preview while building reports.
2. Data Source Connectors
- Connects to your product's databases like PostgreSQL, MySQL, MongoDB, etc.
- API-based data ingestion for custom data sources.
- Includes pre-built connectors for popular services like Stripe and Salesforce.
- Features a data transformation layer for cleaning and normalizing data before visualization.
3. White-Label Customization
- Fully branded to match your product including colors, fonts, and logos.
- Supports custom domains for hosted dashboards.
- Provides CSS and theme customization options.
- Embedding options via iframe, JavaScript SDK, or React components.
4. Dashboard Templates
- Includes pre-built templates for common use cases such as sales analytics, user engagement, and financial reporting.
- Offers a template marketplace for customers to share and discover dashboards.
- Allows cloning and customizing of templates.
5. Sharing & Collaboration
- Schedule automated report delivery via email (daily/weekly/monthly).
- Allows export to PDF, Excel, CSV, or image formats.
- Creates shareable links with permission controls (view-only, edit, admin).
- Facilitates comment threads on specific charts.
6. Security & Permissions
- Features row-level security to ensure tenants only see their own data.
- Role-based access control to define who can create versus view reports.
- Offers SSO integration with SAML and OAuth.
- Maintains audit logs for data access.
7. Performance & Scalability
- Implements query caching to minimize database load.
- Utilizes pre-aggregated data tables for efficient querying of large datasets.
- Delivers embedded components via CDN for optimal performance.
- Provides real-time or scheduled data refresh options.
8. Developer Experience
- REST API for programmatic dashboard/report creation.
- Webhooks for events like new report creation and data export requests.
- SQL editor for power users requiring direct query access.
- Embedded SDK with callbacks and event handlers.
9. Analytics on Analytics
- Tracks report usage to identify commonly utilized reports.
- Identifies power users versus inactive users.
- Offers usage metrics for proactive capacity planning.
Technical Architecture
Backend
- Query engine translates visual configurations into optimized SQL.
- Multi-tenant data isolation layer.
- Caching layer (Redis) optimizes frequently accessed reports.
- Background job queue manages scheduled reports and exports.
Frontend
- React-based chart library leveraging D3.js, Chart.js, or Recharts.
- Ensures responsive design for mobile and tablet devices.
- Compliant with accessibility standards (WCAG 2.1).
Deployment
- Cloud-hosted options on AWS or GCP with multi-region support.
- On-premise installation option available for enterprise customers.
- Kubernetes-based implementation for auto-scaling.
Pricing Model
- Tiered pricing based on the number of end-users who can access reports.
- Additional charges based on data volume processed.
- Enterprise tier for on-premise deployment and custom connectors.
Competitive Differentiation
Our Embedded Analytics & Reporting Builder offers enterprise-grade analytics as a feature without the development cost and time associated with building in-house solutions. We constantly update and introduce new chart types, minimizing your engineering effort while maintaining a seamless, modern user experience.
For further assistance, please refer to the specific guides and tutorials included in this portal. Happy analyzing!
Embedded Analytics & Reporting Builder Support Portal Documentation
Introduction
Welcome to the Support Portal for the Embedded Analytics & Reporting Builder. Our platform offers white-label dashboards and report builders that can be embedded in your product, allowing your customers to generate their own charts and exports without custom development work. This documentation will cover all aspects of using and integrating our analytics solution into your software product.
Tell Us What You Think
We're trying to build something great, but we need your unique perspective to make it even better. Don't hold back and let us know what's on your mind.
Feedback Form
Need to share your thoughts directly? Use the feedback form to leave a quick text feedback.
Ask a Question (Q&A Section)
Have a specific problem or need a solution? Post it here! Below is a public section where our community, our team, or our AI can respond and offer help.
Support Chat
Need personalized support right now? Use the blue chat bubble in the bottom-right corner. This connects you immediately with our support team.
Core Value Proposition
Our solution provides the ability for software companies to embed a complete analytics platform directly into their product, freeing up development resources and offering end-users self-service reporting capabilities. Customers can create customized dashboards, visualize data, and export reports directly within your application's user interface.
Why Choose Embedded Analytics & Reporting Builder?
- Faster implementation compared to building analytics in-house
- Automated updates and new chart types
- Reduces support burden, allowing users to answer their own questions with reports
- Intuitive user experience adhering to modern SaaS standards
Key Features
1. Visual Report Builder (No-Code Interface)
- Drag-and-drop interface for creating charts, tables, and visualizations.
- Supports a variety of chart types including bar, line, pie, scatter, heatmaps, funnels, and cohort analysis.
- Offers easy-to-use filters, grouping, and aggregation controls for non-technical users.
- Provides real-time preview while building reports.
2. Data Source Connectors
- Connects to your product's databases like PostgreSQL, MySQL, MongoDB, etc.
- API-based data ingestion for custom data sources.
- Includes pre-built connectors for popular services like Stripe and Salesforce.
- Features a data transformation layer for cleaning and normalizing data before visualization.
3. White-Label Customization
- Fully branded to match your product including colors, fonts, and logos.
- Supports custom domains for hosted dashboards.
- Provides CSS and theme customization options.
- Embedding options via iframe, JavaScript SDK, or React components.
4. Dashboard Templates
- Includes pre-built templates for common use cases such as sales analytics, user engagement, and financial reporting.
- Offers a template marketplace for customers to share and discover dashboards.
- Allows cloning and customizing of templates.
5. Sharing & Collaboration
- Schedule automated report delivery via email (daily/weekly/monthly).
- Allows export to PDF, Excel, CSV, or image formats.
- Creates shareable links with permission controls (view-only, edit, admin).
- Facilitates comment threads on specific charts.
6. Security & Permissions
- Features row-level security to ensure tenants only see their own data.
- Role-based access control to define who can create versus view reports.
- Offers SSO integration with SAML and OAuth.
- Maintains audit logs for data access.
7. Performance & Scalability
- Implements query caching to minimize database load.
- Utilizes pre-aggregated data tables for efficient querying of large datasets.
- Delivers embedded components via CDN for optimal performance.
- Provides real-time or scheduled data refresh options.
8. Developer Experience
- REST API for programmatic dashboard/report creation.
- Webhooks for events like new report creation and data export requests.
- SQL editor for power users requiring direct query access.
- Embedded SDK with callbacks and event handlers.
9. Analytics on Analytics
- Tracks report usage to identify commonly utilized reports.
- Identifies power users versus inactive users.
- Offers usage metrics for proactive capacity planning.
Technical Architecture
Backend
- Query engine translates visual configurations into optimized SQL.
- Multi-tenant data isolation layer.
- Caching layer (Redis) optimizes frequently accessed reports.
- Background job queue manages scheduled reports and exports.
Frontend
- React-based chart library leveraging D3.js, Chart.js, or Recharts.
- Ensures responsive design for mobile and tablet devices.
- Compliant with accessibility standards (WCAG 2.1).
Deployment
- Cloud-hosted options on AWS or GCP with multi-region support.
- On-premise installation option available for enterprise customers.
- Kubernetes-based implementation for auto-scaling.
Pricing Model
- Tiered pricing based on the number of end-users who can access reports.
- Additional charges based on data volume processed.
- Enterprise tier for on-premise deployment and custom connectors.
Competitive Differentiation
Our Embedded Analytics & Reporting Builder offers enterprise-grade analytics as a feature without the development cost and time associated with building in-house solutions. We constantly update and introduce new chart types, minimizing your engineering effort while maintaining a seamless, modern user experience.
For further assistance, please refer to the specific guides and tutorials included in this portal. Happy analyzing!
Embedded Analytics & Reporting Builder Support Portal Documentation
Introduction
Welcome to the Support Portal for the Embedded Analytics & Reporting Builder. Our platform offers white-label dashboards and report builders that can be embedded in your product, allowing your customers to generate their own charts and exports without custom development work. This documentation will cover all aspects of using and integrating our analytics solution into your software product.
Tell Us What You Think
We're trying to build something great, but we need your unique perspective to make it even better. Don't hold back and let us know what's on your mind.
Feedback Form
Need to share your thoughts directly? Use the feedback form to leave a quick text feedback.
Ask a Question (Q&A Section)
Have a specific problem or need a solution? Post it here! Below is a public section where our community, our team, or our AI can respond and offer help.
Support Chat
Need personalized support right now? Use the blue chat bubble in the bottom-right corner. This connects you immediately with our support team.
Core Value Proposition
Our solution provides the ability for software companies to embed a complete analytics platform directly into their product, freeing up development resources and offering end-users self-service reporting capabilities. Customers can create customized dashboards, visualize data, and export reports directly within your application's user interface.
Why Choose Embedded Analytics & Reporting Builder?
- Faster implementation compared to building analytics in-house
- Automated updates and new chart types
- Reduces support burden, allowing users to answer their own questions with reports
- Intuitive user experience adhering to modern SaaS standards
Key Features
1. Visual Report Builder (No-Code Interface)
- Drag-and-drop interface for creating charts, tables, and visualizations.
- Supports a variety of chart types including bar, line, pie, scatter, heatmaps, funnels, and cohort analysis.
- Offers easy-to-use filters, grouping, and aggregation controls for non-technical users.
- Provides real-time preview while building reports.
2. Data Source Connectors
- Connects to your product's databases like PostgreSQL, MySQL, MongoDB, etc.
- API-based data ingestion for custom data sources.
- Includes pre-built connectors for popular services like Stripe and Salesforce.
- Features a data transformation layer for cleaning and normalizing data before visualization.
3. White-Label Customization
- Fully branded to match your product including colors, fonts, and logos.
- Supports custom domains for hosted dashboards.
- Provides CSS and theme customization options.
- Embedding options via iframe, JavaScript SDK, or React components.
4. Dashboard Templates
- Includes pre-built templates for common use cases such as sales analytics, user engagement, and financial reporting.
- Offers a template marketplace for customers to share and discover dashboards.
- Allows cloning and customizing of templates.
5. Sharing & Collaboration
- Schedule automated report delivery via email (daily/weekly/monthly).
- Allows export to PDF, Excel, CSV, or image formats.
- Creates shareable links with permission controls (view-only, edit, admin).
- Facilitates comment threads on specific charts.
6. Security & Permissions
- Features row-level security to ensure tenants only see their own data.
- Role-based access control to define who can create versus view reports.
- Offers SSO integration with SAML and OAuth.
- Maintains audit logs for data access.
7. Performance & Scalability
- Implements query caching to minimize database load.
- Utilizes pre-aggregated data tables for efficient querying of large datasets.
- Delivers embedded components via CDN for optimal performance.
- Provides real-time or scheduled data refresh options.
8. Developer Experience
- REST API for programmatic dashboard/report creation.
- Webhooks for events like new report creation and data export requests.
- SQL editor for power users requiring direct query access.
- Embedded SDK with callbacks and event handlers.
9. Analytics on Analytics
- Tracks report usage to identify commonly utilized reports.
- Identifies power users versus inactive users.
- Offers usage metrics for proactive capacity planning.
Technical Architecture
Backend
- Query engine translates visual configurations into optimized SQL.
- Multi-tenant data isolation layer.
- Caching layer (Redis) optimizes frequently accessed reports.
- Background job queue manages scheduled reports and exports.
Frontend
- React-based chart library leveraging D3.js, Chart.js, or Recharts.
- Ensures responsive design for mobile and tablet devices.
- Compliant with accessibility standards (WCAG 2.1).
Deployment
- Cloud-hosted options on AWS or GCP with multi-region support.
- On-premise installation option available for enterprise customers.
- Kubernetes-based implementation for auto-scaling.
Pricing Model
- Tiered pricing based on the number of end-users who can access reports.
- Additional charges based on data volume processed.
- Enterprise tier for on-premise deployment and custom connectors.
Competitive Differentiation
Our Embedded Analytics & Reporting Builder offers enterprise-grade analytics as a feature without the development cost and time associated with building in-house solutions. We constantly update and introduce new chart types, minimizing your engineering effort while maintaining a seamless, modern user experience.
For further assistance, please refer to the specific guides and tutorials included in this portal. Happy analyzing!
Embedded Analytics & Reporting Builder Support Portal Documentation
Introduction
Welcome to the Support Portal for the Embedded Analytics & Reporting Builder. Our platform offers white-label dashboards and report builders that can be embedded in your product, allowing your customers to generate their own charts and exports without custom development work. This documentation will cover all aspects of using and integrating our analytics solution into your software product.
Tell Us What You Think
We're trying to build something great, but we need your unique perspective to make it even better. Don't hold back and let us know what's on your mind.
Feedback Form
Need to share your thoughts directly? Use the feedback form to leave a quick text feedback.
Ask a Question (Q&A Section)
Have a specific problem or need a solution? Post it here! Below is a public section where our community, our team, or our AI can respond and offer help.
Support Chat
Need personalized support right now? Use the blue chat bubble in the bottom-right corner. This connects you immediately with our support team.
Core Value Proposition
Our solution provides the ability for software companies to embed a complete analytics platform directly into their product, freeing up development resources and offering end-users self-service reporting capabilities. Customers can create customized dashboards, visualize data, and export reports directly within your application's user interface.
Why Choose Embedded Analytics & Reporting Builder?
- Faster implementation compared to building analytics in-house
- Automated updates and new chart types
- Reduces support burden, allowing users to answer their own questions with reports
- Intuitive user experience adhering to modern SaaS standards
Key Features
1. Visual Report Builder (No-Code Interface)
- Drag-and-drop interface for creating charts, tables, and visualizations.
- Supports a variety of chart types including bar, line, pie, scatter, heatmaps, funnels, and cohort analysis.
- Offers easy-to-use filters, grouping, and aggregation controls for non-technical users.
- Provides real-time preview while building reports.
2. Data Source Connectors
- Connects to your product's databases like PostgreSQL, MySQL, MongoDB, etc.
- API-based data ingestion for custom data sources.
- Includes pre-built connectors for popular services like Stripe and Salesforce.
- Features a data transformation layer for cleaning and normalizing data before visualization.
3. White-Label Customization
- Fully branded to match your product including colors, fonts, and logos.
- Supports custom domains for hosted dashboards.
- Provides CSS and theme customization options.
- Embedding options via iframe, JavaScript SDK, or React components.
4. Dashboard Templates
- Includes pre-built templates for common use cases such as sales analytics, user engagement, and financial reporting.
- Offers a template marketplace for customers to share and discover dashboards.
- Allows cloning and customizing of templates.
5. Sharing & Collaboration
- Schedule automated report delivery via email (daily/weekly/monthly).
- Allows export to PDF, Excel, CSV, or image formats.
- Creates shareable links with permission controls (view-only, edit, admin).
- Facilitates comment threads on specific charts.
6. Security & Permissions
- Features row-level security to ensure tenants only see their own data.
- Role-based access control to define who can create versus view reports.
- Offers SSO integration with SAML and OAuth.
- Maintains audit logs for data access.
7. Performance & Scalability
- Implements query caching to minimize database load.
- Utilizes pre-aggregated data tables for efficient querying of large datasets.
- Delivers embedded components via CDN for optimal performance.
- Provides real-time or scheduled data refresh options.
8. Developer Experience
- REST API for programmatic dashboard/report creation.
- Webhooks for events like new report creation and data export requests.
- SQL editor for power users requiring direct query access.
- Embedded SDK with callbacks and event handlers.
9. Analytics on Analytics
- Tracks report usage to identify commonly utilized reports.
- Identifies power users versus inactive users.
- Offers usage metrics for proactive capacity planning.
Technical Architecture
Backend
- Query engine translates visual configurations into optimized SQL.
- Multi-tenant data isolation layer.
- Caching layer (Redis) optimizes frequently accessed reports.
- Background job queue manages scheduled reports and exports.
Frontend
- React-based chart library leveraging D3.js, Chart.js, or Recharts.
- Ensures responsive design for mobile and tablet devices.
- Compliant with accessibility standards (WCAG 2.1).
Deployment
- Cloud-hosted options on AWS or GCP with multi-region support.
- On-premise installation option available for enterprise customers.
- Kubernetes-based implementation for auto-scaling.
Pricing Model
- Tiered pricing based on the number of end-users who can access reports.
- Additional charges based on data volume processed.
- Enterprise tier for on-premise deployment and custom connectors.
Competitive Differentiation
Our Embedded Analytics & Reporting Builder offers enterprise-grade analytics as a feature without the development cost and time associated with building in-house solutions. We constantly update and introduce new chart types, minimizing your engineering effort while maintaining a seamless, modern user experience.
For further assistance, please refer to the specific guides and tutorials included in this portal. Happy analyzing!
Embedded Analytics & Reporting Builder Support Portal Documentation
Introduction
Welcome to the Support Portal for the Embedded Analytics & Reporting Builder. Our platform offers white-label dashboards and report builders that can be embedded in your product, allowing your customers to generate their own charts and exports without custom development work. This documentation will cover all aspects of using and integrating our analytics solution into your software product.
Tell Us What You Think
We're trying to build something great, but we need your unique perspective to make it even better. Don't hold back and let us know what's on your mind.
Feedback Form
Need to share your thoughts directly? Use the feedback form to leave a quick text feedback.
Ask a Question (Q&A Section)
Have a specific problem or need a solution? Post it here! Below is a public section where our community, our team, or our AI can respond and offer help.
Support Chat
Need personalized support right now? Use the blue chat bubble in the bottom-right corner. This connects you immediately with our support team.
Core Value Proposition
Our solution provides the ability for software companies to embed a complete analytics platform directly into their product, freeing up development resources and offering end-users self-service reporting capabilities. Customers can create customized dashboards, visualize data, and export reports directly within your application's user interface.
Why Choose Embedded Analytics & Reporting Builder?
- Faster implementation compared to building analytics in-house
- Automated updates and new chart types
- Reduces support burden, allowing users to answer their own questions with reports
- Intuitive user experience adhering to modern SaaS standards
Key Features
1. Visual Report Builder (No-Code Interface)
- Drag-and-drop interface for creating charts, tables, and visualizations.
- Supports a variety of chart types including bar, line, pie, scatter, heatmaps, funnels, and cohort analysis.
- Offers easy-to-use filters, grouping, and aggregation controls for non-technical users.
- Provides real-time preview while building reports.
2. Data Source Connectors
- Connects to your product's databases like PostgreSQL, MySQL, MongoDB, etc.
- API-based data ingestion for custom data sources.
- Includes pre-built connectors for popular services like Stripe and Salesforce.
- Features a data transformation layer for cleaning and normalizing data before visualization.
3. White-Label Customization
- Fully branded to match your product including colors, fonts, and logos.
- Supports custom domains for hosted dashboards.
- Provides CSS and theme customization options.
- Embedding options via iframe, JavaScript SDK, or React components.
4. Dashboard Templates
- Includes pre-built templates for common use cases such as sales analytics, user engagement, and financial reporting.
- Offers a template marketplace for customers to share and discover dashboards.
- Allows cloning and customizing of templates.
5. Sharing & Collaboration
- Schedule automated report delivery via email (daily/weekly/monthly).
- Allows export to PDF, Excel, CSV, or image formats.
- Creates shareable links with permission controls (view-only, edit, admin).
- Facilitates comment threads on specific charts.
6. Security & Permissions
- Features row-level security to ensure tenants only see their own data.
- Role-based access control to define who can create versus view reports.
- Offers SSO integration with SAML and OAuth.
- Maintains audit logs for data access.
7. Performance & Scalability
- Implements query caching to minimize database load.
- Utilizes pre-aggregated data tables for efficient querying of large datasets.
- Delivers embedded components via CDN for optimal performance.
- Provides real-time or scheduled data refresh options.
8. Developer Experience
- REST API for programmatic dashboard/report creation.
- Webhooks for events like new report creation and data export requests.
- SQL editor for power users requiring direct query access.
- Embedded SDK with callbacks and event handlers.
9. Analytics on Analytics
- Tracks report usage to identify commonly utilized reports.
- Identifies power users versus inactive users.
- Offers usage metrics for proactive capacity planning.
Technical Architecture
Backend
- Query engine translates visual configurations into optimized SQL.
- Multi-tenant data isolation layer.
- Caching layer (Redis) optimizes frequently accessed reports.
- Background job queue manages scheduled reports and exports.
Frontend
- React-based chart library leveraging D3.js, Chart.js, or Recharts.
- Ensures responsive design for mobile and tablet devices.
- Compliant with accessibility standards (WCAG 2.1).
Deployment
- Cloud-hosted options on AWS or GCP with multi-region support.
- On-premise installation option available for enterprise customers.
- Kubernetes-based implementation for auto-scaling.
Pricing Model
- Tiered pricing based on the number of end-users who can access reports.
- Additional charges based on data volume processed.
- Enterprise tier for on-premise deployment and custom connectors.
Competitive Differentiation
Our Embedded Analytics & Reporting Builder offers enterprise-grade analytics as a feature without the development cost and time associated with building in-house solutions. We constantly update and introduce new chart types, minimizing your engineering effort while maintaining a seamless, modern user experience.
For further assistance, please refer to the specific guides and tutorials included in this portal. Happy analyzing!
Embedded Analytics & Reporting Builder Support Portal Documentation
Introduction
Welcome to the Support Portal for the Embedded Analytics & Reporting Builder. Our platform offers white-label dashboards and report builders that can be embedded in your product, allowing your customers to generate their own charts and exports without custom development work. This documentation will cover all aspects of using and integrating our analytics solution into your software product.
Tell Us What You Think
We're trying to build something great, but we need your unique perspective to make it even better. Don't hold back and let us know what's on your mind.
Feedback Form
Need to share your thoughts directly? Use the feedback form to leave a quick text feedback.
Ask a Question (Q&A Section)
Have a specific problem or need a solution? Post it here! Below is a public section where our community, our team, or our AI can respond and offer help.
Support Chat
Need personalized support right now? Use the blue chat bubble in the bottom-right corner. This connects you immediately with our support team.
Core Value Proposition
Our solution provides the ability for software companies to embed a complete analytics platform directly into their product, freeing up development resources and offering end-users self-service reporting capabilities. Customers can create customized dashboards, visualize data, and export reports directly within your application's user interface.
Why Choose Embedded Analytics & Reporting Builder?
- Faster implementation compared to building analytics in-house
- Automated updates and new chart types
- Reduces support burden, allowing users to answer their own questions with reports
- Intuitive user experience adhering to modern SaaS standards
Key Features
1. Visual Report Builder (No-Code Interface)
- Drag-and-drop interface for creating charts, tables, and visualizations.
- Supports a variety of chart types including bar, line, pie, scatter, heatmaps, funnels, and cohort analysis.
- Offers easy-to-use filters, grouping, and aggregation controls for non-technical users.
- Provides real-time preview while building reports.
2. Data Source Connectors
- Connects to your product's databases like PostgreSQL, MySQL, MongoDB, etc.
- API-based data ingestion for custom data sources.
- Includes pre-built connectors for popular services like Stripe and Salesforce.
- Features a data transformation layer for cleaning and normalizing data before visualization.
3. White-Label Customization
- Fully branded to match your product including colors, fonts, and logos.
- Supports custom domains for hosted dashboards.
- Provides CSS and theme customization options.
- Embedding options via iframe, JavaScript SDK, or React components.
4. Dashboard Templates
- Includes pre-built templates for common use cases such as sales analytics, user engagement, and financial reporting.
- Offers a template marketplace for customers to share and discover dashboards.
- Allows cloning and customizing of templates.
5. Sharing & Collaboration
- Schedule automated report delivery via email (daily/weekly/monthly).
- Allows export to PDF, Excel, CSV, or image formats.
- Creates shareable links with permission controls (view-only, edit, admin).
- Facilitates comment threads on specific charts.
6. Security & Permissions
- Features row-level security to ensure tenants only see their own data.
- Role-based access control to define who can create versus view reports.
- Offers SSO integration with SAML and OAuth.
- Maintains audit logs for data access.
7. Performance & Scalability
- Implements query caching to minimize database load.
- Utilizes pre-aggregated data tables for efficient querying of large datasets.
- Delivers embedded components via CDN for optimal performance.
- Provides real-time or scheduled data refresh options.
8. Developer Experience
- REST API for programmatic dashboard/report creation.
- Webhooks for events like new report creation and data export requests.
- SQL editor for power users requiring direct query access.
- Embedded SDK with callbacks and event handlers.
9. Analytics on Analytics
- Tracks report usage to identify commonly utilized reports.
- Identifies power users versus inactive users.
- Offers usage metrics for proactive capacity planning.
Technical Architecture
Backend
- Query engine translates visual configurations into optimized SQL.
- Multi-tenant data isolation layer.
- Caching layer (Redis) optimizes frequently accessed reports.
- Background job queue manages scheduled reports and exports.
Frontend
- React-based chart library leveraging D3.js, Chart.js, or Recharts.
- Ensures responsive design for mobile and tablet devices.
- Compliant with accessibility standards (WCAG 2.1).
Deployment
- Cloud-hosted options on AWS or GCP with multi-region support.
- On-premise installation option available for enterprise customers.
- Kubernetes-based implementation for auto-scaling.
Pricing Model
- Tiered pricing based on the number of end-users who can access reports.
- Additional charges based on data volume processed.
- Enterprise tier for on-premise deployment and custom connectors.
Competitive Differentiation
Our Embedded Analytics & Reporting Builder offers enterprise-grade analytics as a feature without the development cost and time associated with building in-house solutions. We constantly update and introduce new chart types, minimizing your engineering effort while maintaining a seamless, modern user experience.
For further assistance, please refer to the specific guides and tutorials included in this portal. Happy analyzing!
Embedded Analytics & Reporting Builder Support Portal Documentation
Introduction
Welcome to the Support Portal for the Embedded Analytics & Reporting Builder. Our platform offers white-label dashboards and report builders that can be embedded in your product, allowing your customers to generate their own charts and exports without custom development work. This documentation will cover all aspects of using and integrating our analytics solution into your software product.
Tell Us What You Think
We're trying to build something great, but we need your unique perspective to make it even better. Don't hold back and let us know what's on your mind.
Feedback Form
Need to share your thoughts directly? Use the feedback form to leave a quick text feedback.
Ask a Question (Q&A Section)
Have a specific problem or need a solution? Post it here! Below is a public section where our community, our team, or our AI can respond and offer help.
Support Chat
Need personalized support right now? Use the blue chat bubble in the bottom-right corner. This connects you immediately with our support team.
Core Value Proposition
Our solution provides the ability for software companies to embed a complete analytics platform directly into their product, freeing up development resources and offering end-users self-service reporting capabilities. Customers can create customized dashboards, visualize data, and export reports directly within your application's user interface.
Why Choose Embedded Analytics & Reporting Builder?
- Faster implementation compared to building analytics in-house
- Automated updates and new chart types
- Reduces support burden, allowing users to answer their own questions with reports
- Intuitive user experience adhering to modern SaaS standards
Key Features
1. Visual Report Builder (No-Code Interface)
- Drag-and-drop interface for creating charts, tables, and visualizations.
- Supports a variety of chart types including bar, line, pie, scatter, heatmaps, funnels, and cohort analysis.
- Offers easy-to-use filters, grouping, and aggregation controls for non-technical users.
- Provides real-time preview while building reports.
2. Data Source Connectors
- Connects to your product's databases like PostgreSQL, MySQL, MongoDB, etc.
- API-based data ingestion for custom data sources.
- Includes pre-built connectors for popular services like Stripe and Salesforce.
- Features a data transformation layer for cleaning and normalizing data before visualization.
3. White-Label Customization
- Fully branded to match your product including colors, fonts, and logos.
- Supports custom domains for hosted dashboards.
- Provides CSS and theme customization options.
- Embedding options via iframe, JavaScript SDK, or React components.
4. Dashboard Templates
- Includes pre-built templates for common use cases such as sales analytics, user engagement, and financial reporting.
- Offers a template marketplace for customers to share and discover dashboards.
- Allows cloning and customizing of templates.
5. Sharing & Collaboration
- Schedule automated report delivery via email (daily/weekly/monthly).
- Allows export to PDF, Excel, CSV, or image formats.
- Creates shareable links with permission controls (view-only, edit, admin).
- Facilitates comment threads on specific charts.
6. Security & Permissions
- Features row-level security to ensure tenants only see their own data.
- Role-based access control to define who can create versus view reports.
- Offers SSO integration with SAML and OAuth.
- Maintains audit logs for data access.
7. Performance & Scalability
- Implements query caching to minimize database load.
- Utilizes pre-aggregated data tables for efficient querying of large datasets.
- Delivers embedded components via CDN for optimal performance.
- Provides real-time or scheduled data refresh options.
8. Developer Experience
- REST API for programmatic dashboard/report creation.
- Webhooks for events like new report creation and data export requests.
- SQL editor for power users requiring direct query access.
- Embedded SDK with callbacks and event handlers.
9. Analytics on Analytics
- Tracks report usage to identify commonly utilized reports.
- Identifies power users versus inactive users.
- Offers usage metrics for proactive capacity planning.
Technical Architecture
Backend
- Query engine translates visual configurations into optimized SQL.
- Multi-tenant data isolation layer.
- Caching layer (Redis) optimizes frequently accessed reports.
- Background job queue manages scheduled reports and exports.
Frontend
- React-based chart library leveraging D3.js, Chart.js, or Recharts.
- Ensures responsive design for mobile and tablet devices.
- Compliant with accessibility standards (WCAG 2.1).
Deployment
- Cloud-hosted options on AWS or GCP with multi-region support.
- On-premise installation option available for enterprise customers.
- Kubernetes-based implementation for auto-scaling.
Pricing Model
- Tiered pricing based on the number of end-users who can access reports.
- Additional charges based on data volume processed.
- Enterprise tier for on-premise deployment and custom connectors.
Competitive Differentiation
Our Embedded Analytics & Reporting Builder offers enterprise-grade analytics as a feature without the development cost and time associated with building in-house solutions. We constantly update and introduce new chart types, minimizing your engineering effort while maintaining a seamless, modern user experience.
For further assistance, please refer to the specific guides and tutorials included in this portal. Happy analyzing!
Embedded Analytics & Reporting Builder Support Portal Documentation
Introduction
Welcome to the Support Portal for the Embedded Analytics & Reporting Builder. Our platform offers white-label dashboards and report builders that can be embedded in your product, allowing your customers to generate their own charts and exports without custom development work. This documentation will cover all aspects of using and integrating our analytics solution into your software product.
Tell Us What You Think
We're trying to build something great, but we need your unique perspective to make it even better. Don't hold back and let us know what's on your mind.
Feedback Form
Need to share your thoughts directly? Use the feedback form to leave a quick text feedback.
Ask a Question (Q&A Section)
Have a specific problem or need a solution? Post it here! Below is a public section where our community, our team, or our AI can respond and offer help.
Support Chat
Need personalized support right now? Use the blue chat bubble in the bottom-right corner. This connects you immediately with our support team.
Core Value Proposition
Our solution provides the ability for software companies to embed a complete analytics platform directly into their product, freeing up development resources and offering end-users self-service reporting capabilities. Customers can create customized dashboards, visualize data, and export reports directly within your application's user interface.
Why Choose Embedded Analytics & Reporting Builder?
- Faster implementation compared to building analytics in-house
- Automated updates and new chart types
- Reduces support burden, allowing users to answer their own questions with reports
- Intuitive user experience adhering to modern SaaS standards
Key Features
1. Visual Report Builder (No-Code Interface)
- Drag-and-drop interface for creating charts, tables, and visualizations.
- Supports a variety of chart types including bar, line, pie, scatter, heatmaps, funnels, and cohort analysis.
- Offers easy-to-use filters, grouping, and aggregation controls for non-technical users.
- Provides real-time preview while building reports.
2. Data Source Connectors
- Connects to your product's databases like PostgreSQL, MySQL, MongoDB, etc.
- API-based data ingestion for custom data sources.
- Includes pre-built connectors for popular services like Stripe and Salesforce.
- Features a data transformation layer for cleaning and normalizing data before visualization.
3. White-Label Customization
- Fully branded to match your product including colors, fonts, and logos.
- Supports custom domains for hosted dashboards.
- Provides CSS and theme customization options.
- Embedding options via iframe, JavaScript SDK, or React components.
4. Dashboard Templates
- Includes pre-built templates for common use cases such as sales analytics, user engagement, and financial reporting.
- Offers a template marketplace for customers to share and discover dashboards.
- Allows cloning and customizing of templates.
5. Sharing & Collaboration
- Schedule automated report delivery via email (daily/weekly/monthly).
- Allows export to PDF, Excel, CSV, or image formats.
- Creates shareable links with permission controls (view-only, edit, admin).
- Facilitates comment threads on specific charts.
6. Security & Permissions
- Features row-level security to ensure tenants only see their own data.
- Role-based access control to define who can create versus view reports.
- Offers SSO integration with SAML and OAuth.
- Maintains audit logs for data access.
7. Performance & Scalability
- Implements query caching to minimize database load.
- Utilizes pre-aggregated data tables for efficient querying of large datasets.
- Delivers embedded components via CDN for optimal performance.
- Provides real-time or scheduled data refresh options.
8. Developer Experience
- REST API for programmatic dashboard/report creation.
- Webhooks for events like new report creation and data export requests.
- SQL editor for power users requiring direct query access.
- Embedded SDK with callbacks and event handlers.
9. Analytics on Analytics
- Tracks report usage to identify commonly utilized reports.
- Identifies power users versus inactive users.
- Offers usage metrics for proactive capacity planning.
Technical Architecture
Backend
- Query engine translates visual configurations into optimized SQL.
- Multi-tenant data isolation layer.
- Caching layer (Redis) optimizes frequently accessed reports.
- Background job queue manages scheduled reports and exports.
Frontend
- React-based chart library leveraging D3.js, Chart.js, or Recharts.
- Ensures responsive design for mobile and tablet devices.
- Compliant with accessibility standards (WCAG 2.1).
Deployment
- Cloud-hosted options on AWS or GCP with multi-region support.
- On-premise installation option available for enterprise customers.
- Kubernetes-based implementation for auto-scaling.
Pricing Model
- Tiered pricing based on the number of end-users who can access reports.
- Additional charges based on data volume processed.
- Enterprise tier for on-premise deployment and custom connectors.
Competitive Differentiation
Our Embedded Analytics & Reporting Builder offers enterprise-grade analytics as a feature without the development cost and time associated with building in-house solutions. We constantly update and introduce new chart types, minimizing your engineering effort while maintaining a seamless, modern user experience.
For further assistance, please refer to the specific guides and tutorials included in this portal. Happy analyzing!
Embedded Analytics & Reporting Builder Support Portal Documentation
Introduction
Welcome to the Support Portal for the Embedded Analytics & Reporting Builder. Our platform offers white-label dashboards and report builders that can be embedded in your product, allowing your customers to generate their own charts and exports without custom development work. This documentation will cover all aspects of using and integrating our analytics solution into your software product.
Tell Us What You Think
We're trying to build something great, but we need your unique perspective to make it even better. Don't hold back and let us know what's on your mind.
Feedback Form
Need to share your thoughts directly? Use the feedback form to leave a quick text feedback.
Ask a Question (Q&A Section)
Have a specific problem or need a solution? Post it here! Below is a public section where our community, our team, or our AI can respond and offer help.
Support Chat
Need personalized support right now? Use the blue chat bubble in the bottom-right corner. This connects you immediately with our support team.
Core Value Proposition
Our solution provides the ability for software companies to embed a complete analytics platform directly into their product, freeing up development resources and offering end-users self-service reporting capabilities. Customers can create customized dashboards, visualize data, and export reports directly within your application's user interface.
Why Choose Embedded Analytics & Reporting Builder?
- Faster implementation compared to building analytics in-house
- Automated updates and new chart types
- Reduces support burden, allowing users to answer their own questions with reports
- Intuitive user experience adhering to modern SaaS standards
Key Features
1. Visual Report Builder (No-Code Interface)
- Drag-and-drop interface for creating charts, tables, and visualizations.
- Supports a variety of chart types including bar, line, pie, scatter, heatmaps, funnels, and cohort analysis.
- Offers easy-to-use filters, grouping, and aggregation controls for non-technical users.
- Provides real-time preview while building reports.
2. Data Source Connectors
- Connects to your product's databases like PostgreSQL, MySQL, MongoDB, etc.
- API-based data ingestion for custom data sources.
- Includes pre-built connectors for popular services like Stripe and Salesforce.
- Features a data transformation layer for cleaning and normalizing data before visualization.
3. White-Label Customization
- Fully branded to match your product including colors, fonts, and logos.
- Supports custom domains for hosted dashboards.
- Provides CSS and theme customization options.
- Embedding options via iframe, JavaScript SDK, or React components.
4. Dashboard Templates
- Includes pre-built templates for common use cases such as sales analytics, user engagement, and financial reporting.
- Offers a template marketplace for customers to share and discover dashboards.
- Allows cloning and customizing of templates.
5. Sharing & Collaboration
- Schedule automated report delivery via email (daily/weekly/monthly).
- Allows export to PDF, Excel, CSV, or image formats.
- Creates shareable links with permission controls (view-only, edit, admin).
- Facilitates comment threads on specific charts.
6. Security & Permissions
- Features row-level security to ensure tenants only see their own data.
- Role-based access control to define who can create versus view reports.
- Offers SSO integration with SAML and OAuth.
- Maintains audit logs for data access.
7. Performance & Scalability
- Implements query caching to minimize database load.
- Utilizes pre-aggregated data tables for efficient querying of large datasets.
- Delivers embedded components via CDN for optimal performance.
- Provides real-time or scheduled data refresh options.
8. Developer Experience
- REST API for programmatic dashboard/report creation.
- Webhooks for events like new report creation and data export requests.
- SQL editor for power users requiring direct query access.
- Embedded SDK with callbacks and event handlers.
9. Analytics on Analytics
- Tracks report usage to identify commonly utilized reports.
- Identifies power users versus inactive users.
- Offers usage metrics for proactive capacity planning.
Technical Architecture
Backend
- Query engine translates visual configurations into optimized SQL.
- Multi-tenant data isolation layer.
- Caching layer (Redis) optimizes frequently accessed reports.
- Background job queue manages scheduled reports and exports.
Frontend
- React-based chart library leveraging D3.js, Chart.js, or Recharts.
- Ensures responsive design for mobile and tablet devices.
- Compliant with accessibility standards (WCAG 2.1).
Deployment
- Cloud-hosted options on AWS or GCP with multi-region support.
- On-premise installation option available for enterprise customers.
- Kubernetes-based implementation for auto-scaling.
Pricing Model
- Tiered pricing based on the number of end-users who can access reports.
- Additional charges based on data volume processed.
- Enterprise tier for on-premise deployment and custom connectors.
Competitive Differentiation
Our Embedded Analytics & Reporting Builder offers enterprise-grade analytics as a feature without the development cost and time associated with building in-house solutions. We constantly update and introduce new chart types, minimizing your engineering effort while maintaining a seamless, modern user experience.
For further assistance, please refer to the specific guides and tutorials included in this portal. Happy analyzing!Embedded Analytics & Reporting Builder Support Portal Documentation
Introduction
Welcome to the Support Portal for the Embedded Analytics & Reporting Builder. Our platform offers white-label dashboards and report builders that can be embedded in your product, allowing your customers to generate their own charts and exports without custom development work. This documentation will cover all aspects of using and integrating our analytics solution into your software product.
Tell Us What You Think
We're trying to build something great, but we need your unique perspective to make it even better. Don't hold back and let us know what's on your mind.
Feedback Form
Need to share your thoughts directly? Use the feedback form to leave a quick text feedback.
Ask a Question (Q&A Section)
Have a specific problem or need a solution? Post it here! Below is a public section where our community, our team, or our AI can respond and offer help.
Support Chat
Need personalized support right now? Use the blue chat bubble in the bottom-right corner. This connects you immediately with our support team.
Core Value Proposition
Our solution provides the ability for software companies to embed a complete analytics platform directly into their product, freeing up development resources and offering end-users self-service reporting capabilities. Customers can create customized dashboards, visualize data, and export reports directly within your application's user interface.
Why Choose Embedded Analytics & Reporting Builder?
- Faster implementation compared to building analytics in-house
- Automated updates and new chart types
- Reduces support burden, allowing users to answer their own questions with reports
- Intuitive user experience adhering to modern SaaS standards
Key Features
1. Visual Report Builder (No-Code Interface)
- Drag-and-drop interface for creating charts, tables, and visualizations.
- Supports a variety of chart types including bar, line, pie, scatter, heatmaps, funnels, and cohort analysis.
- Offers easy-to-use filters, grouping, and aggregation controls for non-technical users.
- Provides real-time preview while building reports.
2. Data Source Connectors
- Connects to your product's databases like PostgreSQL, MySQL, MongoDB, etc.
- API-based data ingestion for custom data sources.
- Includes pre-built connectors for popular services like Stripe and Salesforce.
- Features a data transformation layer for cleaning and normalizing data before visualization.
3. White-Label Customization
- Fully branded to match your product including colors, fonts, and logos.
- Supports custom domains for hosted dashboards.
- Provides CSS and theme customization options.
- Embedding options via iframe, JavaScript SDK, or React components.
4. Dashboard Templates
- Includes pre-built templates for common use cases such as sales analytics, user engagement, and financial reporting.
- Offers a template marketplace for customers to share and discover dashboards.
- Allows cloning and customizing of templates.
5. Sharing & Collaboration
- Schedule automated report delivery via email (daily/weekly/monthly).
- Allows export to PDF, Excel, CSV, or image formats.
- Creates shareable links with permission controls (view-only, edit, admin).
- Facilitates comment threads on specific charts.
6. Security & Permissions
- Features row-level security to ensure tenants only see their own data.
- Role-based access control to define who can create versus view reports.
- Offers SSO integration with SAML and OAuth.
- Maintains audit logs for data access.
7. Performance & Scalability
- Implements query caching to minimize database load.
- Utilizes pre-aggregated data tables for efficient querying of large datasets.
- Delivers embedded components via CDN for optimal performance.
- Provides real-time or scheduled data refresh options.
8. Developer Experience
- REST API for programmatic dashboard/report creation.
- Webhooks for events like new report creation and data export requests.
- SQL editor for power users requiring direct query access.
- Embedded SDK with callbacks and event handlers.
9. Analytics on Analytics
- Tracks report usage to identify commonly utilized reports.
- Identifies power users versus inactive users.
- Offers usage metrics for proactive capacity planning.
Technical Architecture
Backend
- Query engine translates visual configurations into optimized SQL.
- Multi-tenant data isolation layer.
- Caching layer (Redis) optimizes frequently accessed reports.
- Background job queue manages scheduled reports and exports.
Frontend
- React-based chart library leveraging D3.js, Chart.js, or Recharts.
- Ensures responsive design for mobile and tablet devices.
- Compliant with accessibility standards (WCAG 2.1).
Deployment
- Cloud-hosted options on AWS or GCP with multi-region support.
- On-premise installation option available for enterprise customers.
- Kubernetes-based implementation for auto-scaling.
Pricing Model
- Tiered pricing based on the number of end-users who can access reports.
- Additional charges based on data volume processed.
- Enterprise tier for on-premise deployment and custom connectors.
Competitive Differentiation
Our Embedded Analytics & Reporting Builder offers enterprise-grade analytics as a feature without the development cost and time associated with building in-house solutions. We constantly update and introduce new chart types, minimizing your engineering effort while maintaining a seamless, modern user experience.
For further assistance, please refer to the specific guides and tutorials included in this portal. Happy analyzing!
Embedded Analytics & Reporting Builder Support Portal Documentation
Introduction
Welcome to the Support Portal for the Embedded Analytics & Reporting Builder. Our platform offers white-label dashboards and report builders that can be embedded in your product, allowing your customers to generate their own charts and exports without custom development work. This documentation will cover all aspects of using and integrating our analytics solution into your software product.
Tell Us What You Think
We're trying to build something great, but we need your unique perspective to make it even better. Don't hold back and let us know what's on your mind.
Feedback Form
Need to share your thoughts directly? Use the feedback form to leave a quick text feedback.
Ask a Question (Q&A Section)
Have a specific problem or need a solution? Post it here! Below is a public section where our community, our team, or our AI can respond and offer help.
Support Chat
Need personalized support right now? Use the blue chat bubble in the bottom-right corner. This connects you immediately with our support team.
Core Value Proposition
Our solution provides the ability for software companies to embed a complete analytics platform directly into their product, freeing up development resources and offering end-users self-service reporting capabilities. Customers can create customized dashboards, visualize data, and export reports directly within your application's user interface.
Why Choose Embedded Analytics & Reporting Builder?
- Faster implementation compared to building analytics in-house
- Automated updates and new chart types
- Reduces support burden, allowing users to answer their own questions with reports
- Intuitive user experience adhering to modern SaaS standards
Key Features
1. Visual Report Builder (No-Code Interface)
- Drag-and-drop interface for creating charts, tables, and visualizations.
- Supports a variety of chart types including bar, line, pie, scatter, heatmaps, funnels, and cohort analysis.
- Offers easy-to-use filters, grouping, and aggregation controls for non-technical users.
- Provides real-time preview while building reports.
2. Data Source Connectors
- Connects to your product's databases like PostgreSQL, MySQL, MongoDB, etc.
- API-based data ingestion for custom data sources.
- Includes pre-built connectors for popular services like Stripe and Salesforce.
- Features a data transformation layer for cleaning and normalizing data before visualization.
3. White-Label Customization
- Fully branded to match your product including colors, fonts, and logos.
- Supports custom domains for hosted dashboards.
- Provides CSS and theme customization options.
- Embedding options via iframe, JavaScript SDK, or React components.
4. Dashboard Templates
- Includes pre-built templates for common use cases such as sales analytics, user engagement, and financial reporting.
- Offers a template marketplace for customers to share and discover dashboards.
- Allows cloning and customizing of templates.
5. Sharing & Collaboration
- Schedule automated report delivery via email (daily/weekly/monthly).
- Allows export to PDF, Excel, CSV, or image formats.
- Creates shareable links with permission controls (view-only, edit, admin).
- Facilitates comment threads on specific charts.
6. Security & Permissions
- Features row-level security to ensure tenants only see their own data.
- Role-based access control to define who can create versus view reports.
- Offers SSO integration with SAML and OAuth.
- Maintains audit logs for data access.
7. Performance & Scalability
- Implements query caching to minimize database load.
- Utilizes pre-aggregated data tables for efficient querying of large datasets.
- Delivers embedded components via CDN for optimal performance.
- Provides real-time or scheduled data refresh options.
8. Developer Experience
- REST API for programmatic dashboard/report creation.
- Webhooks for events like new report creation and data export requests.
- SQL editor for power users requiring direct query access.
- Embedded SDK with callbacks and event handlers.
9. Analytics on Analytics
- Tracks report usage to identify commonly utilized reports.
- Identifies power users versus inactive users.
- Offers usage metrics for proactive capacity planning.
Technical Architecture
Backend
- Query engine translates visual configurations into optimized SQL.
- Multi-tenant data isolation layer.
- Caching layer (Redis) optimizes frequently accessed reports.
- Background job queue manages scheduled reports and exports.
Frontend
- React-based chart library leveraging D3.js, Chart.js, or Recharts.
- Ensures responsive design for mobile and tablet devices.
- Compliant with accessibility standards (WCAG 2.1).
Deployment
- Cloud-hosted options on AWS or GCP with multi-region support.
- On-premise installation option available for enterprise customers.
- Kubernetes-based implementation for auto-scaling.
Pricing Model
- Tiered pricing based on the number of end-users who can access reports.
- Additional charges based on data volume processed.
- Enterprise tier for on-premise deployment and custom connectors.
Competitive Differentiation
Our Embedded Analytics & Reporting Builder offers enterprise-grade analytics as a feature without the development cost and time associated with building in-house solutions. We constantly update and introduce new chart types, minimizing your engineering effort while maintaining a seamless, modern user experience.
For further assistance, please refer to the specific guides and tutorials included in this portal. Happy analyzing!Embedded Analytics & Reporting Builder Support Portal Documentation
Introduction
Welcome to the Support Portal for the Embedded Analytics & Reporting Builder. Our platform offers white-label dashboards and report builders that can be embedded in your product, allowing your customers to generate their own charts and exports without custom development work. This documentation will cover all aspects of using and integrating our analytics solution into your software product.
Tell Us What You Think
We're trying to build something great, but we need your unique perspective to make it even better. Don't hold back and let us know what's on your mind.
Feedback Form
Need to share your thoughts directly? Use the feedback form to leave a quick text feedback.
Ask a Question (Q&A Section)
Have a specific problem or need a solution? Post it here! Below is a public section where our community, our team, or our AI can respond and offer help.
Support Chat
Need personalized support right now? Use the blue chat bubble in the bottom-right corner. This connects you immediately with our support team.
Core Value Proposition
Our solution provides the ability for software companies to embed a complete analytics platform directly into their product, freeing up development resources and offering end-users self-service reporting capabilities. Customers can create customized dashboards, visualize data, and export reports directly within your application's user interface.
Why Choose Embedded Analytics & Reporting Builder?
- Faster implementation compared to building analytics in-house
- Automated updates and new chart types
- Reduces support burden, allowing users to answer their own questions with reports
- Intuitive user experience adhering to modern SaaS standards
Key Features
1. Visual Report Builder (No-Code Interface)
- Drag-and-drop interface for creating charts, tables, and visualizations.
- Supports a variety of chart types including bar, line, pie, scatter, heatmaps, funnels, and cohort analysis.
- Offers easy-to-use filters, grouping, and aggregation controls for non-technical users.
- Provides real-time preview while building reports.
2. Data Source Connectors
- Connects to your product's databases like PostgreSQL, MySQL, MongoDB, etc.
- API-based data ingestion for custom data sources.
- Includes pre-built connectors for popular services like Stripe and Salesforce.
- Features a data transformation layer for cleaning and normalizing data before visualization.
3. White-Label Customization
- Fully branded to match your product including colors, fonts, and logos.
- Supports custom domains for hosted dashboards.
- Provides CSS and theme customization options.
- Embedding options via iframe, JavaScript SDK, or React components.
4. Dashboard Templates
- Includes pre-built templates for common use cases such as sales analytics, user engagement, and financial reporting.
- Offers a template marketplace for customers to share and discover dashboards.
- Allows cloning and customizing of templates.
5. Sharing & Collaboration
- Schedule automated report delivery via email (daily/weekly/monthly).
- Allows export to PDF, Excel, CSV, or image formats.
- Creates shareable links with permission controls (view-only, edit, admin).
- Facilitates comment threads on specific charts.
6. Security & Permissions
- Features row-level security to ensure tenants only see their own data.
- Role-based access control to define who can create versus view reports.
- Offers SSO integration with SAML and OAuth.
- Maintains audit logs for data access.
7. Performance & Scalability
- Implements query caching to minimize database load.
- Utilizes pre-aggregated data tables for efficient querying of large datasets.
- Delivers embedded components via CDN for optimal performance.
- Provides real-time or scheduled data refresh options.
8. Developer Experience
- REST API for programmatic dashboard/report creation.
- Webhooks for events like new report creation and data export requests.
- SQL editor for power users requiring direct query access.
- Embedded SDK with callbacks and event handlers.
9. Analytics on Analytics
- Tracks report usage to identify commonly utilized reports.
- Identifies power users versus inactive users.
- Offers usage metrics for proactive capacity planning.
Technical Architecture
Backend
- Query engine translates visual configurations into optimized SQL.
- Multi-tenant data isolation layer.
- Caching layer (Redis) optimizes frequently accessed reports.
- Background job queue manages scheduled reports and exports.
Frontend
- React-based chart library leveraging D3.js, Chart.js, or Recharts.
- Ensures responsive design for mobile and tablet devices.
- Compliant with accessibility standards (WCAG 2.1).
Deployment
- Cloud-hosted options on AWS or GCP with multi-region support.
- On-premise installation option available for enterprise customers.
- Kubernetes-based implementation for auto-scaling.
Pricing Model
- Tiered pricing based on the number of end-users who can access reports.
- Additional charges based on data volume processed.
- Enterprise tier for on-premise deployment and custom connectors.
Competitive Differentiation
Our Embedded Analytics & Reporting Builder offers enterprise-grade analytics as a feature without the development cost and time associated with building in-house solutions. We constantly update and introduce new chart types, minimizing your engineering effort while maintaining a seamless, modern user experience.
For further assistance, please refer to the specific guides and tutorials included in this portal. Happy analyzing!Embedded Analytics & Reporting Builder Support Portal Documentation
Introduction
Welcome to the Support Portal for the Embedded Analytics & Reporting Builder. Our platform offers white-label dashboards and report builders that can be embedded in your product, allowing your customers to generate their own charts and exports without custom development work. This documentation will cover all aspects of using and integrating our analytics solution into your software product.
Tell Us What You Think
We're trying to build something great, but we need your unique perspective to make it even better. Don't hold back and let us know what's on your mind.
Feedback Form
Need to share your thoughts directly? Use the feedback form to leave a quick text feedback.
Ask a Question (Q&A Section)
Have a specific problem or need a solution? Post it here! Below is a public section where our community, our team, or our AI can respond and offer help.
Support Chat
Need personalized support right now? Use the blue chat bubble in the bottom-right corner. This connects you immediately with our support team.
Core Value Proposition
Our solution provides the ability for software companies to embed a complete analytics platform directly into their product, freeing up development resources and offering end-users self-service reporting capabilities. Customers can create customized dashboards, visualize data, and export reports directly within your application's user interface.
Why Choose Embedded Analytics & Reporting Builder?
- Faster implementation compared to building analytics in-house
- Automated updates and new chart types
- Reduces support burden, allowing users to answer their own questions with reports
- Intuitive user experience adhering to modern SaaS standards
Key Features
1. Visual Report Builder (No-Code Interface)
- Drag-and-drop interface for creating charts, tables, and visualizations.
- Supports a variety of chart types including bar, line, pie, scatter, heatmaps, funnels, and cohort analysis.
- Offers easy-to-use filters, grouping, and aggregation controls for non-technical users.
- Provides real-time preview while building reports.
2. Data Source Connectors
- Connects to your product's databases like PostgreSQL, MySQL, MongoDB, etc.
- API-based data ingestion for custom data sources.
- Includes pre-built connectors for popular services like Stripe and Salesforce.
- Features a data transformation layer for cleaning and normalizing data before visualization.
3. White-Label Customization
- Fully branded to match your product including colors, fonts, and logos.
- Supports custom domains for hosted dashboards.
- Provides CSS and theme customization options.
- Embedding options via iframe, JavaScript SDK, or React components.
4. Dashboard Templates
- Includes pre-built templates for common use cases such as sales analytics, user engagement, and financial reporting.
- Offers a template marketplace for customers to share and discover dashboards.
- Allows cloning and customizing of templates.
5. Sharing & Collaboration
- Schedule automated report delivery via email (daily/weekly/monthly).
- Allows export to PDF, Excel, CSV, or image formats.
- Creates shareable links with permission controls (view-only, edit, admin).
- Facilitates comment threads on specific charts.
6. Security & Permissions
- Features row-level security to ensure tenants only see their own data.
- Role-based access control to define who can create versus view reports.
- Offers SSO integration with SAML and OAuth.
- Maintains audit logs for data access.
7. Performance & Scalability
- Implements query caching to minimize database load.
- Utilizes pre-aggregated data tables for efficient querying of large datasets.
- Delivers embedded components via CDN for optimal performance.
- Provides real-time or scheduled data refresh options.
8. Developer Experience
- REST API for programmatic dashboard/report creation.
- Webhooks for events like new report creation and data export requests.
- SQL editor for power users requiring direct query access.
- Embedded SDK with callbacks and event handlers.
9. Analytics on Analytics
- Tracks report usage to identify commonly utilized reports.
- Identifies power users versus inactive users.
- Offers usage metrics for proactive capacity planning.
Technical Architecture
Backend
- Query engine translates visual configurations into optimized SQL.
- Multi-tenant data isolation layer.
- Caching layer (Redis) optimizes frequently accessed reports.
- Background job queue manages scheduled reports and exports.
Frontend
- React-based chart library leveraging D3.js, Chart.js, or Recharts.
- Ensures responsive design for mobile and tablet devices.
- Compliant with accessibility standards (WCAG 2.1).
Deployment
- Cloud-hosted options on AWS or GCP with multi-region support.
- On-premise installation option available for enterprise customers.
- Kubernetes-based implementation for auto-scaling.
Pricing Model
- Tiered pricing based on the number of end-users who can access reports.
- Additional charges based on data volume processed.
- Enterprise tier for on-premise deployment and custom connectors.
Competitive Differentiation
Our Embedded Analytics & Reporting Builder offers enterprise-grade analytics as a feature without the development cost and time associated with building in-house solutions. We constantly update and introduce new chart types, minimizing your engineering effort while maintaining a seamless, modern user experience.
For further assistance, please refer to the specific guides and tutorials included in this portal. Happy analyzing!Embedded Analytics & Reporting Builder Support Portal Documentation
Introduction
Welcome to the Support Portal for the Embedded Analytics & Reporting Builder. Our platform offers white-label dashboards and report builders that can be embedded in your product, allowing your customers to generate their own charts and exports without custom development work. This documentation will cover all aspects of using and integrating our analytics solution into your software product.
Tell Us What You Think
We're trying to build something great, but we need your unique perspective to make it even better. Don't hold back and let us know what's on your mind.
Feedback Form
Need to share your thoughts directly? Use the feedback form to leave a quick text feedback.
Ask a Question (Q&A Section)
Have a specific problem or need a solution? Post it here! Below is a public section where our community, our team, or our AI can respond and offer help.
Support Chat
Need personalized support right now? Use the blue chat bubble in the bottom-right corner. This connects you immediately with our support team.
Core Value Proposition
Our solution provides the ability for software companies to embed a complete analytics platform directly into their product, freeing up development resources and offering end-users self-service reporting capabilities. Customers can create customized dashboards, visualize data, and export reports directly within your application's user interface.
Why Choose Embedded Analytics & Reporting Builder?
- Faster implementation compared to building analytics in-house
- Automated updates and new chart types
- Reduces support burden, allowing users to answer their own questions with reports
- Intuitive user experience adhering to modern SaaS standards
Key Features
1. Visual Report Builder (No-Code Interface)
- Drag-and-drop interface for creating charts, tables, and visualizations.
- Supports a variety of chart types including bar, line, pie, scatter, heatmaps, funnels, and cohort analysis.
- Offers easy-to-use filters, grouping, and aggregation controls for non-technical users.
- Provides real-time preview while building reports.
2. Data Source Connectors
- Connects to your product's databases like PostgreSQL, MySQL, MongoDB, etc.
- API-based data ingestion for custom data sources.
- Includes pre-built connectors for popular services like Stripe and Salesforce.
- Features a data transformation layer for cleaning and normalizing data before visualization.
3. White-Label Customization
- Fully branded to match your product including colors, fonts, and logos.
- Supports custom domains for hosted dashboards.
- Provides CSS and theme customization options.
- Embedding options via iframe, JavaScript SDK, or React components.
4. Dashboard Templates
- Includes pre-built templates for common use cases such as sales analytics, user engagement, and financial reporting.
- Offers a template marketplace for customers to share and discover dashboards.
- Allows cloning and customizing of templates.
5. Sharing & Collaboration
- Schedule automated report delivery via email (daily/weekly/monthly).
- Allows export to PDF, Excel, CSV, or image formats.
- Creates shareable links with permission controls (view-only, edit, admin).
- Facilitates comment threads on specific charts.
6. Security & Permissions
- Features row-level security to ensure tenants only see their own data.
- Role-based access control to define who can create versus view reports.
- Offers SSO integration with SAML and OAuth.
- Maintains audit logs for data access.
7. Performance & Scalability
- Implements query caching to minimize database load.
- Utilizes pre-aggregated data tables for efficient querying of large datasets.
- Delivers embedded components via CDN for optimal performance.
- Provides real-time or scheduled data refresh options.
8. Developer Experience
- REST API for programmatic dashboard/report creation.
- Webhooks for events like new report creation and data export requests.
- SQL editor for power users requiring direct query access.
- Embedded SDK with callbacks and event handlers.
9. Analytics on Analytics
- Tracks report usage to identify commonly utilized reports.
- Identifies power users versus inactive users.
- Offers usage metrics for proactive capacity planning.
Technical Architecture
Backend
- Query engine translates visual configurations into optimized SQL.
- Multi-tenant data isolation layer.
- Caching layer (Redis) optimizes frequently accessed reports.
- Background job queue manages scheduled reports and exports.
Frontend
- React-based chart library leveraging D3.js, Chart.js, or Recharts.
- Ensures responsive design for mobile and tablet devices.
- Compliant with accessibility standards (WCAG 2.1).
Deployment
- Cloud-hosted options on AWS or GCP with multi-region support.
- On-premise installation option available for enterprise customers.
- Kubernetes-based implementation for auto-scaling.
Pricing Model
- Tiered pricing based on the number of end-users who can access reports.
- Additional charges based on data volume processed.
- Enterprise tier for on-premise deployment and custom connectors.
Competitive Differentiation
Our Embedded Analytics & Reporting Builder offers enterprise-grade analytics as a feature without the development cost and time associated with building in-house solutions. We constantly update and introduce new chart types, minimizing your engineering effort while maintaining a seamless, modern user experience.
For further assistance, please refer to the specific guides and tutorials included in this portal. Happy analyzing!
Embedded Analytics & Reporting Builder Support Portal Documentation
Introduction
Welcome to the Support Portal for the Embedded Analytics & Reporting Builder. Our platform offers white-label dashboards and report builders that can be embedded in your product, allowing your customers to generate their own charts and exports without custom development work. This documentation will cover all aspects of using and integrating our analytics solution into your software product.
Tell Us What You Think
We're trying to build something great, but we need your unique perspective to make it even better. Don't hold back and let us know what's on your mind.
Feedback Form
Need to share your thoughts directly? Use the feedback form to leave a quick text feedback.
Ask a Question (Q&A Section)
Have a specific problem or need a solution? Post it here! Below is a public section where our community, our team, or our AI can respond and offer help.
Support Chat
Need personalized support right now? Use the blue chat bubble in the bottom-right corner. This connects you immediately with our support team.
Core Value Proposition
Our solution provides the ability for software companies to embed a complete analytics platform directly into their product, freeing up development resources and offering end-users self-service reporting capabilities. Customers can create customized dashboards, visualize data, and export reports directly within your application's user interface.
Why Choose Embedded Analytics & Reporting Builder?
- Faster implementation compared to building analytics in-house
- Automated updates and new chart types
- Reduces support burden, allowing users to answer their own questions with reports
- Intuitive user experience adhering to modern SaaS standards
Key Features
1. Visual Report Builder (No-Code Interface)
- Drag-and-drop interface for creating charts, tables, and visualizations.
- Supports a variety of chart types including bar, line, pie, scatter, heatmaps, funnels, and cohort analysis.
- Offers easy-to-use filters, grouping, and aggregation controls for non-technical users.
- Provides real-time preview while building reports.
2. Data Source Connectors
- Connects to your product's databases like PostgreSQL, MySQL, MongoDB, etc.
- API-based data ingestion for custom data sources.
- Includes pre-built connectors for popular services like Stripe and Salesforce.
- Features a data transformation layer for cleaning and normalizing data before visualization.
3. White-Label Customization
- Fully branded to match your product including colors, fonts, and logos.
- Supports custom domains for hosted dashboards.
- Provides CSS and theme customization options.
- Embedding options via iframe, JavaScript SDK, or React components.
4. Dashboard Templates
- Includes pre-built templates for common use cases such as sales analytics, user engagement, and financial reporting.
- Offers a template marketplace for customers to share and discover dashboards.
- Allows cloning and customizing of templates.
5. Sharing & Collaboration
- Schedule automated report delivery via email (daily/weekly/monthly).
- Allows export to PDF, Excel, CSV, or image formats.
- Creates shareable links with permission controls (view-only, edit, admin).
- Facilitates comment threads on specific charts.
6. Security & Permissions
- Features row-level security to ensure tenants only see their own data.
- Role-based access control to define who can create versus view reports.
- Offers SSO integration with SAML and OAuth.
- Maintains audit logs for data access.
7. Performance & Scalability
- Implements query caching to minimize database load.
- Utilizes pre-aggregated data tables for efficient querying of large datasets.
- Delivers embedded components via CDN for optimal performance.
- Provides real-time or scheduled data refresh options.
8. Developer Experience
- REST API for programmatic dashboard/report creation.
- Webhooks for events like new report creation and data export requests.
- SQL editor for power users requiring direct query access.
- Embedded SDK with callbacks and event handlers.
9. Analytics on Analytics
- Tracks report usage to identify commonly utilized reports.
- Identifies power users versus inactive users.
- Offers usage metrics for proactive capacity planning.
Technical Architecture
Backend
- Query engine translates visual configurations into optimized SQL.
- Multi-tenant data isolation layer.
- Caching layer (Redis) optimizes frequently accessed reports.
- Background job queue manages scheduled reports and exports.
Frontend
- React-based chart library leveraging D3.js, Chart.js, or Recharts.
- Ensures responsive design for mobile and tablet devices.
- Compliant with accessibility standards (WCAG 2.1).
Deployment
- Cloud-hosted options on AWS or GCP with multi-region support.
- On-premise installation option available for enterprise customers.
- Kubernetes-based implementation for auto-scaling.
Pricing Model
- Tiered pricing based on the number of end-users who can access reports.
- Additional charges based on data volume processed.
- Enterprise tier for on-premise deployment and custom connectors.
Competitive Differentiation
Our Embedded Analytics & Reporting Builder offers enterprise-grade analytics as a feature without the development cost and time associated with building in-house solutions. We constantly update and introduce new chart types, minimizing your engineering effort while maintaining a seamless, modern user experience.
For further assistance, please refer to the specific guides and tutorials included in this portal. Happy analyzing!Embedded Analytics & Reporting Builder Support Portal Documentation
Introduction
Welcome to the Support Portal for the Embedded Analytics & Reporting Builder. Our platform offers white-label dashboards and report builders that can be embedded in your product, allowing your customers to generate their own charts and exports without custom development work. This documentation will cover all aspects of using and integrating our analytics solution into your software product.
Tell Us What You Think
We're trying to build something great, but we need your unique perspective to make it even better. Don't hold back and let us know what's on your mind.
Feedback Form
Need to share your thoughts directly? Use the feedback form to leave a quick text feedback.
Ask a Question (Q&A Section)
Have a specific problem or need a solution? Post it here! Below is a public section where our community, our team, or our AI can respond and offer help.
Support Chat
Need personalized support right now? Use the blue chat bubble in the bottom-right corner. This connects you immediately with our support team.
Core Value Proposition
Our solution provides the ability for software companies to embed a complete analytics platform directly into their product, freeing up development resources and offering end-users self-service reporting capabilities. Customers can create customized dashboards, visualize data, and export reports directly within your application's user interface.
Why Choose Embedded Analytics & Reporting Builder?
- Faster implementation compared to building analytics in-house
- Automated updates and new chart types
- Reduces support burden, allowing users to answer their own questions with reports
- Intuitive user experience adhering to modern SaaS standards
Key Features
1. Visual Report Builder (No-Code Interface)
- Drag-and-drop interface for creating charts, tables, and visualizations.
- Supports a variety of chart types including bar, line, pie, scatter, heatmaps, funnels, and cohort analysis.
- Offers easy-to-use filters, grouping, and aggregation controls for non-technical users.
- Provides real-time preview while building reports.
2. Data Source Connectors
- Connects to your product's databases like PostgreSQL, MySQL, MongoDB, etc.
- API-based data ingestion for custom data sources.
- Includes pre-built connectors for popular services like Stripe and Salesforce.
- Features a data transformation layer for cleaning and normalizing data before visualization.
3. White-Label Customization
- Fully branded to match your product including colors, fonts, and logos.
- Supports custom domains for hosted dashboards.
- Provides CSS and theme customization options.
- Embedding options via iframe, JavaScript SDK, or React components.
4. Dashboard Templates
- Includes pre-built templates for common use cases such as sales analytics, user engagement, and financial reporting.
- Offers a template marketplace for customers to share and discover dashboards.
- Allows cloning and customizing of templates.
5. Sharing & Collaboration
- Schedule automated report delivery via email (daily/weekly/monthly).
- Allows export to PDF, Excel, CSV, or image formats.
- Creates shareable links with permission controls (view-only, edit, admin).
- Facilitates comment threads on specific charts.
6. Security & Permissions
- Features row-level security to ensure tenants only see their own data.
- Role-based access control to define who can create versus view reports.
- Offers SSO integration with SAML and OAuth.
- Maintains audit logs for data access.
7. Performance & Scalability
- Implements query caching to minimize database load.
- Utilizes pre-aggregated data tables for efficient querying of large datasets.
- Delivers embedded components via CDN for optimal performance.
- Provides real-time or scheduled data refresh options.
8. Developer Experience
- REST API for programmatic dashboard/report creation.
- Webhooks for events like new report creation and data export requests.
- SQL editor for power users requiring direct query access.
- Embedded SDK with callbacks and event handlers.
9. Analytics on Analytics
- Tracks report usage to identify commonly utilized reports.
- Identifies power users versus inactive users.
- Offers usage metrics for proactive capacity planning.
Technical Architecture
Backend
- Query engine translates visual configurations into optimized SQL.
- Multi-tenant data isolation layer.
- Caching layer (Redis) optimizes frequently accessed reports.
- Background job queue manages scheduled reports and exports.
Frontend
- React-based chart library leveraging D3.js, Chart.js, or Recharts.
- Ensures responsive design for mobile and tablet devices.
- Compliant with accessibility standards (WCAG 2.1).
Deployment
- Cloud-hosted options on AWS or GCP with multi-region support.
- On-premise installation option available for enterprise customers.
- Kubernetes-based implementation for auto-scaling.
Pricing Model
- Tiered pricing based on the number of end-users who can access reports.
- Additional charges based on data volume processed.
- Enterprise tier for on-premise deployment and custom connectors.
Competitive Differentiation
Our Embedded Analytics & Reporting Builder offers enterprise-grade analytics as a feature without the development cost and time associated with building in-house solutions. We constantly update and introduce new chart types, minimizing your engineering effort while maintaining a seamless, modern user experience.
For further assistance, please refer to the specific guides and tutorials included in this portal. Happy analyzing!